Understanding Data Discovery Grid Colors
The Data Discovery module displays colors for certain cells and headers in grids to correspond with Data Discovery Notes and highlight key information. For example, if you run Data Discovery on Entity Proportion Adjustment members, the Entity Proportion Adjustment related cells will be highlighted. This enables you to more quickly locate and focus on the cells that need attention.
Examples
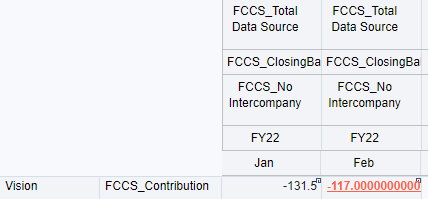
Root Cell
The cell that you select for Data Discovery is marked red in grids.

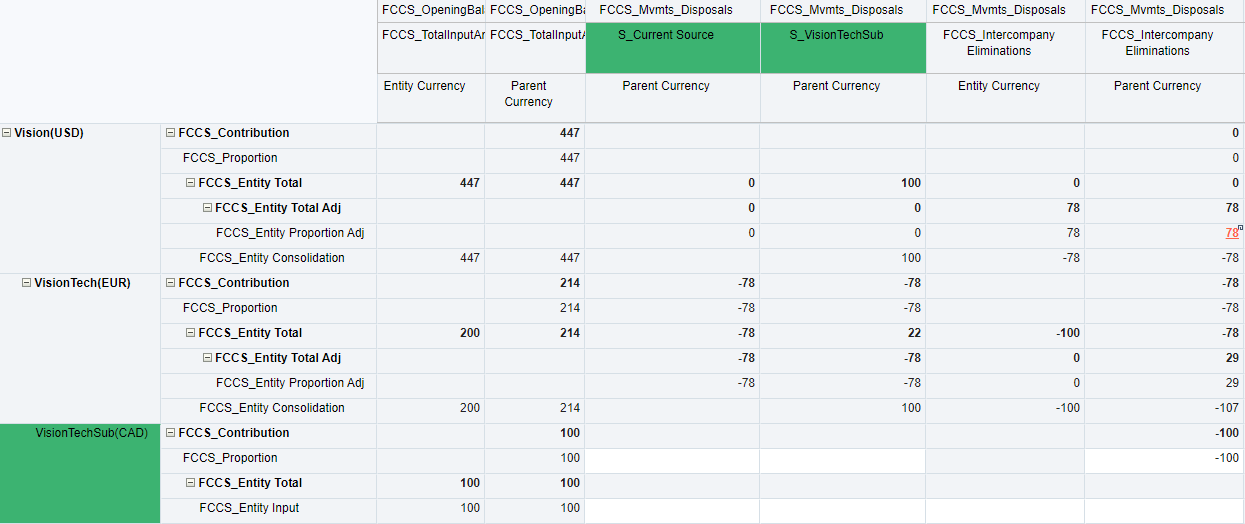
Key Member
Key members such as S_<Entity> will be represented by a green
background in the Reference Grid, as well as the corresponding Entity member.

Discovery Observations and Corresponding Colors
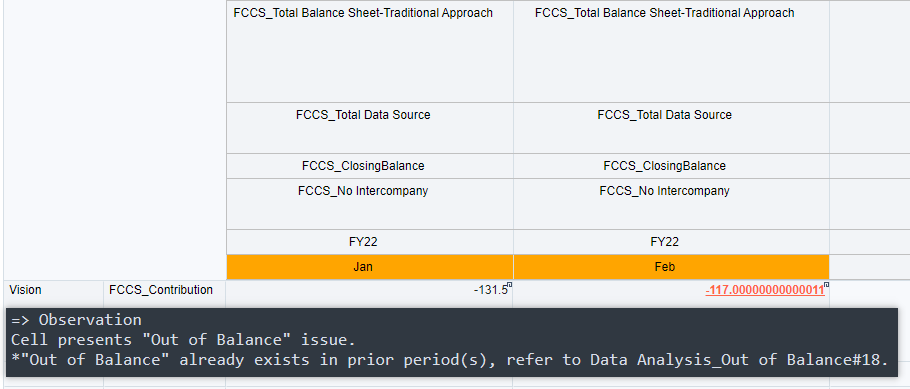
When a Data Discovery Note shows observation(s) for specific cells in grids, the system marks the cells with an orange background.
Case 1 - Prior Period(s) Out of Balance
According to the observation, the system marks the Period members with orange
background.
Case 2 - Inconsistent Exchange Rate
In this case, the wrong exchange rate was input directly to CAD-EUR, which is not consistent with the system auto-triangulated rate. The system marks the specific cells with an orange background.

Case 3 - Intercompany Account without Plug Account Associated

Case 4 - Potential Inconsistent Ownership Setting
