Understanding Data Discovery Output
Output in Data Discovery Grids Folder
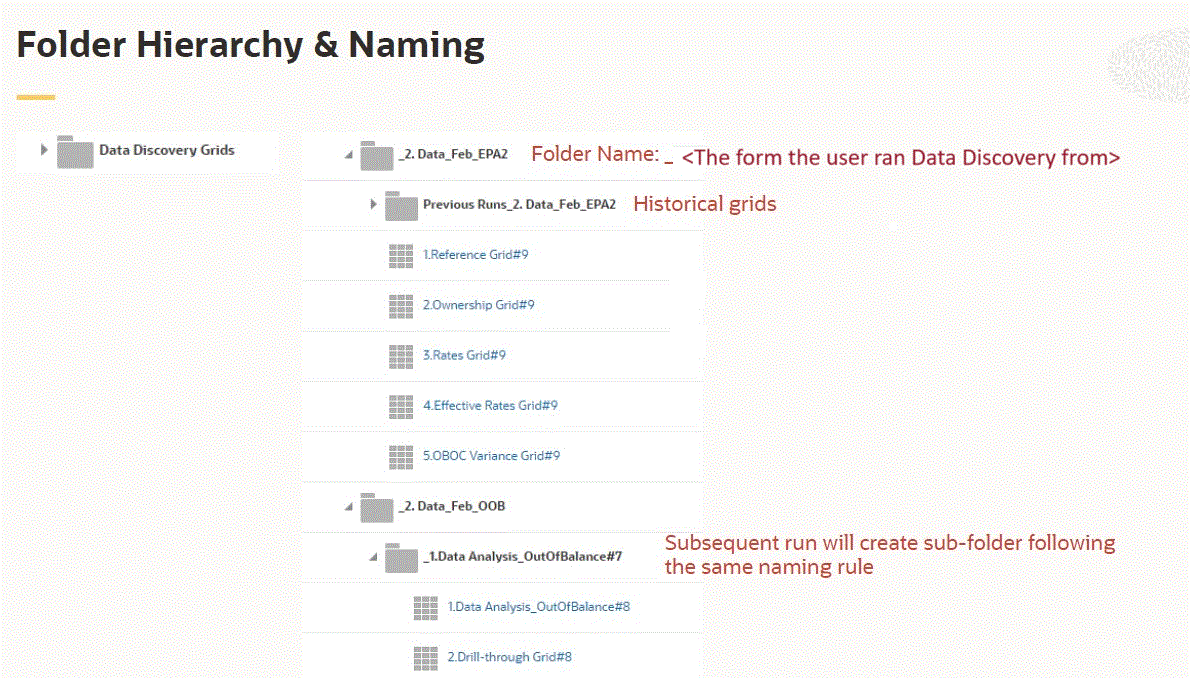
Understanding the Naming of Folders and Grids
All grids generated by Data Discovery are under this folder: Data Discovery Grids.
Each form from which you run Data Discovery has its own subfolder named "_" + <Form Name>.
Grids directly under each subfolder are the latest ones, old grids will be moved to a subfolder named "Previous Runs_" + <Form Name>.
Each grid is named by <Grid Name> + "#" + <Sequence Num>.
Running Grids on Different Cell Levels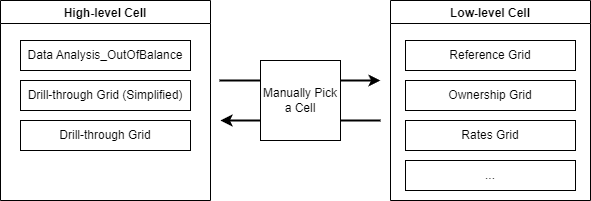
You can run Data Discovery on any cell, but the result is different output grids depending on the cell level.
Running Data Discovery on a high-level cell triggers "Out of Balance" analysis and drilling through, you can locate a lower-level cell closer to where the data is generated.
You can decide the direction of diagnosis. The generated grids may vary based on the cell you select each time.
If the following dimension members are all level 0, the system will generate the main reference grid and corresponding grids based on feature enablement and cell context.
- Account
- Movement
- Data Source
- Intercompany (If Intercompany Data is enabled)
Data Analysis_Out of Balance Grid
The Data Analysis_Out of Balance grid is designed for an "Out of Balance" scenario.
The system identifies the cell as "Out of Balance" if the Account member is Total Balance Sheet (this account varies based on different application settings) and the Movement member is Closing Balance.
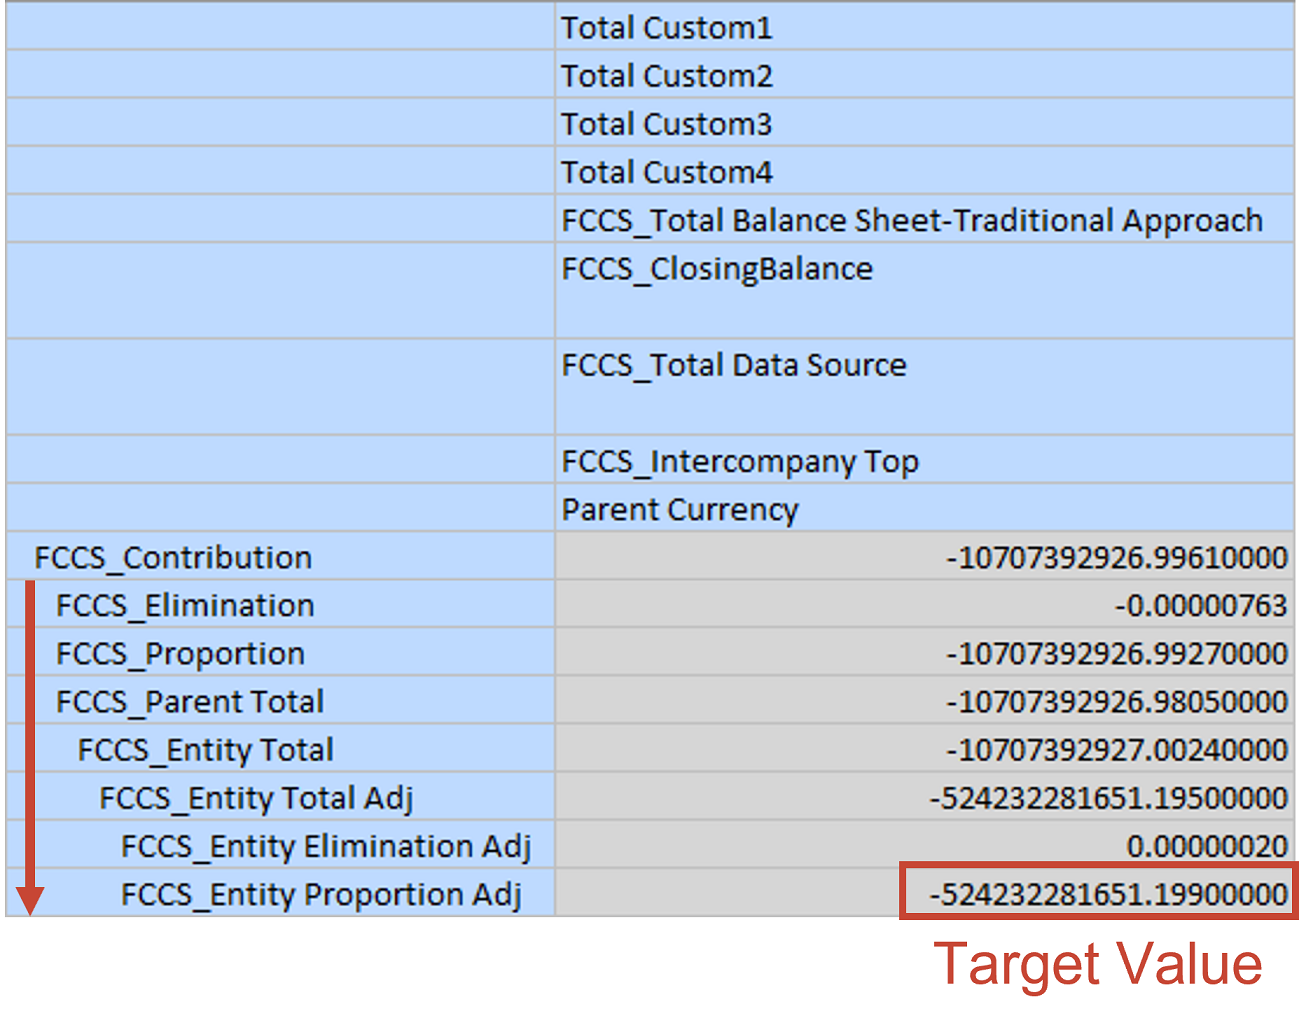
The system uses the initial Out of Balance value as the target value, then searches it while drilling down in each dimension until the intersection cannot be drilled down any more. The goal is to expose some key members to further locate the root cause of the Out of Balance scenario.
Components
- Drill down to the logically lowest Consolidation member and refresh the target value, for example from Contribution to Proportion, if you selected the Find lowest-level Consolidation member in OOB Drill-through option in Data Discovery Settings.
- Drill down to the lowest level Entity member (if there are multiple entities, the system will pick a random one) and refresh the target value if you selected the Find lowest-level entity in OOB Drill-through option in Data Discovery Settings.
- Drill down to find the lowest member in other dimensions searching for the target value. You can control the order of dimension drilling down in by using Re-order Dimensions in Data Discovery Settings.
- When searching the target value, the system only compares the integer value unless you disable the Compare only integer value in OOB Drill-through option in Data Discovery Settings.
-
A normal Drill-through Grid will be generated based on the last intersection processed in the above steps.
Example Grid - Initial Intersection
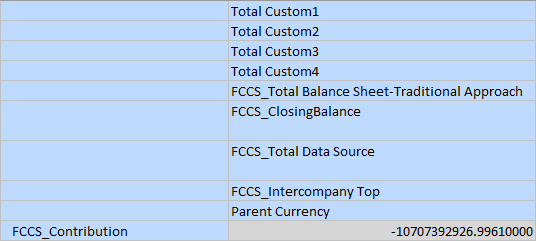
Find lowest Consolidation member
Expand each dimension except Account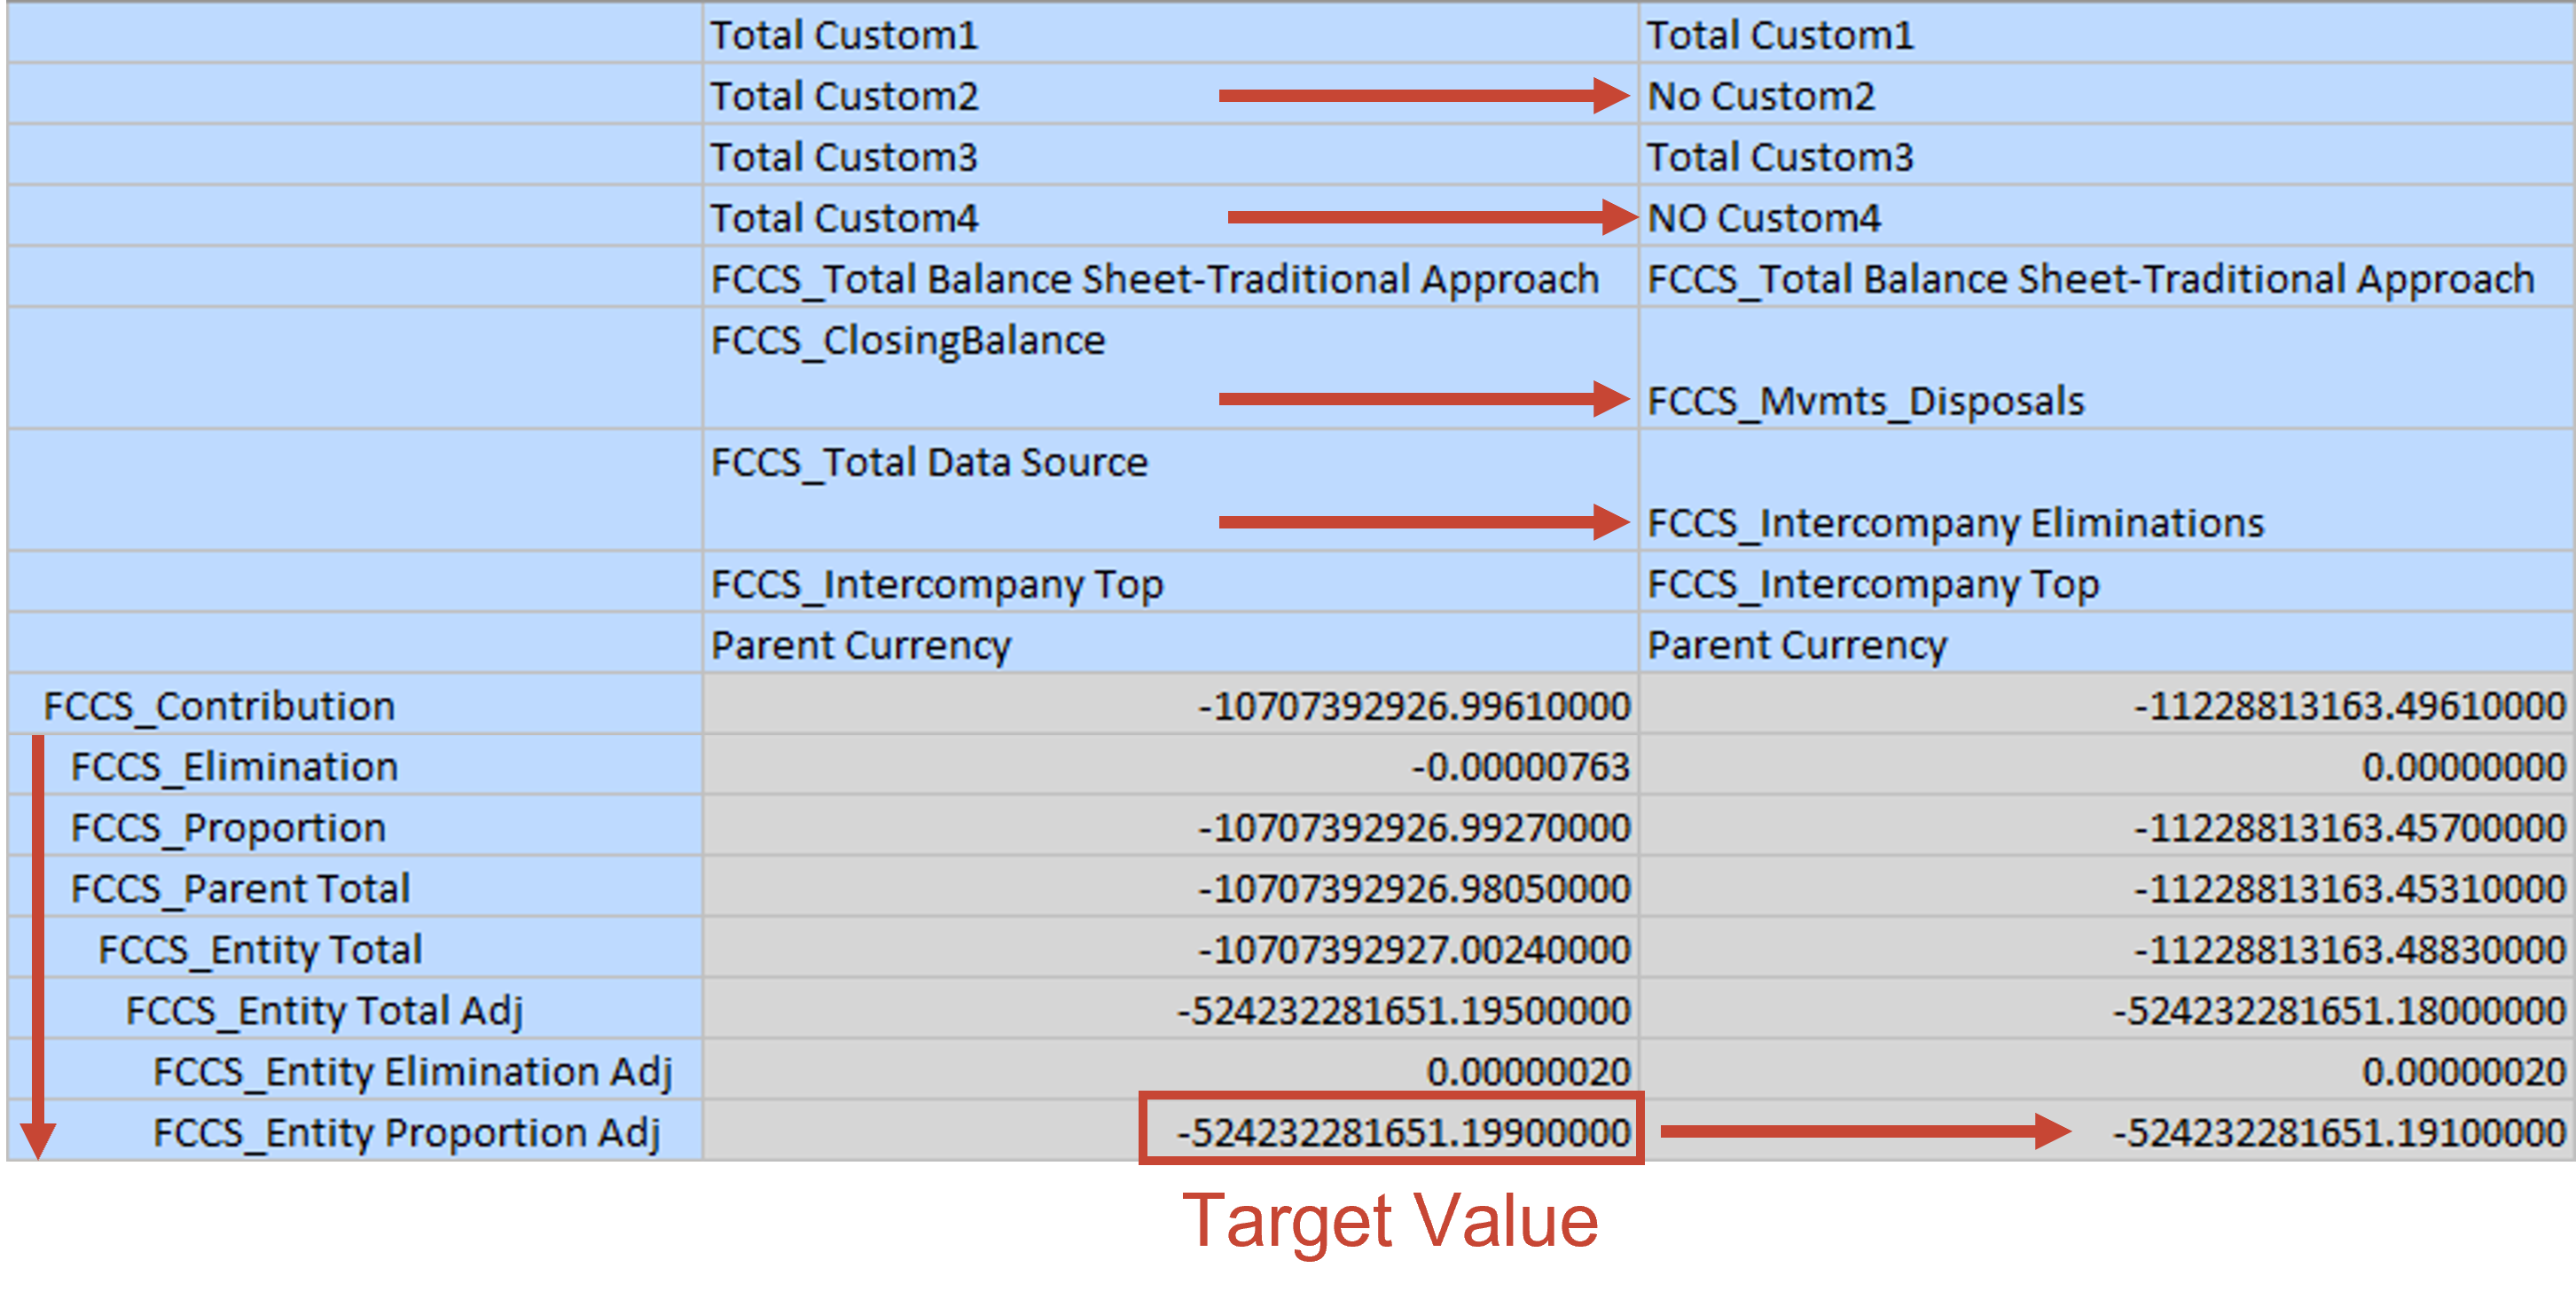
Drill-through Grid
This grid helps to slice and dice on a high-level cell.
This grid automatically drills down in each dimension to a level 0 member, while filtering out ZERO and #MISSING values.
You can choose to not drill down in Custom dimensions by selecting the Exclude Custom dimension in Drill-through option in Data Discovery Settings.
Drill-through Grid - Initial Intersection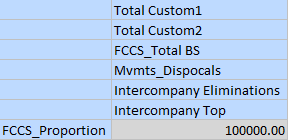

Drill-through Grid (Simplified)
The Simplified Drill-through Grid has fewer columns than the Drill-through Grid.
In this grid, the system filters out duplicated columns using the following rules:
- The Movement and Data Source member combination must be unique
- Keep one account for each Account Category: Account Type + Time Balance + Exchange Rate Type + Is ICP Account
- Keep one combination of Custom dimension members
- Keep two members (No ICP and ICP_XXX) at most of Intercompany dimension
As a result, the example Drill-through Grid will shrink as shown below (assuming
Account_102 has same category with Account_101):
Reference Grid
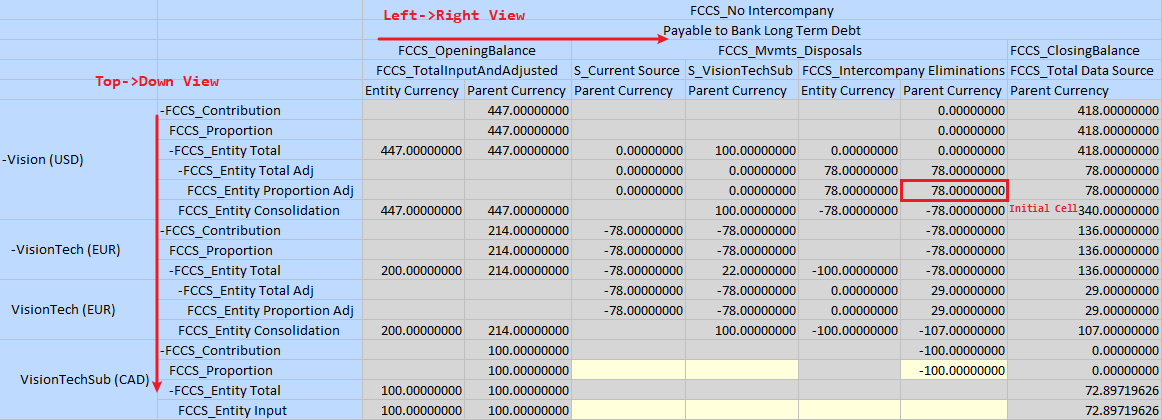
The Reference Grid is the main grid generated by Data Discovery to help you understand the data flow of a destination data cell.
In Data Discovery Settings, rules are defined to control Reference Grid behavior.
Entity and Consolidation members are always in rows.
Scenario, Year, Period and View members are in the POV bar unless they are different between columns.
Other dimension members are always in columns.
The Rules define how to extend the initial column to show the data flow. For example, if the system detects an Opening Balance member, then Closing Balance of last period will be displayed on the left side of the initial column.
Ownership Grid
The Ownership Grid is generated along with the Reference Grid, if Ownership Management is enabled.

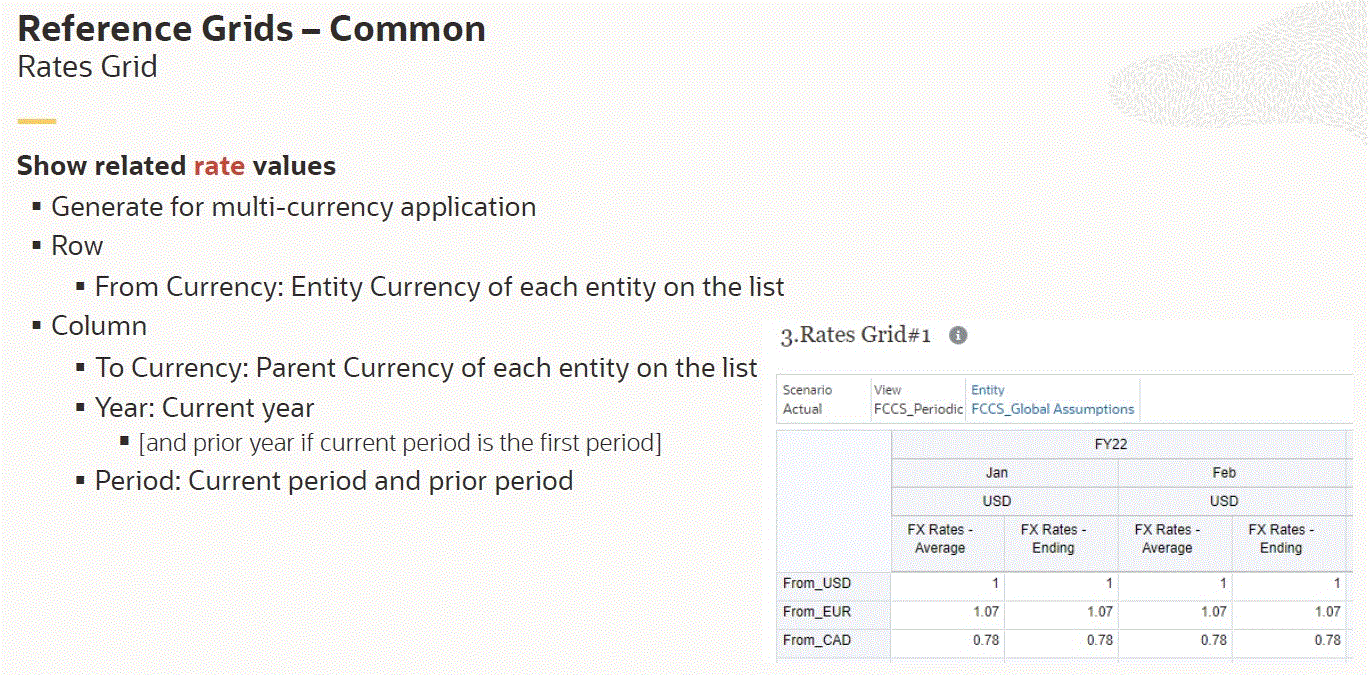
Rates Grid
The Rates Grid is generated along with the Reference Grid, if multi-currency is enabled.
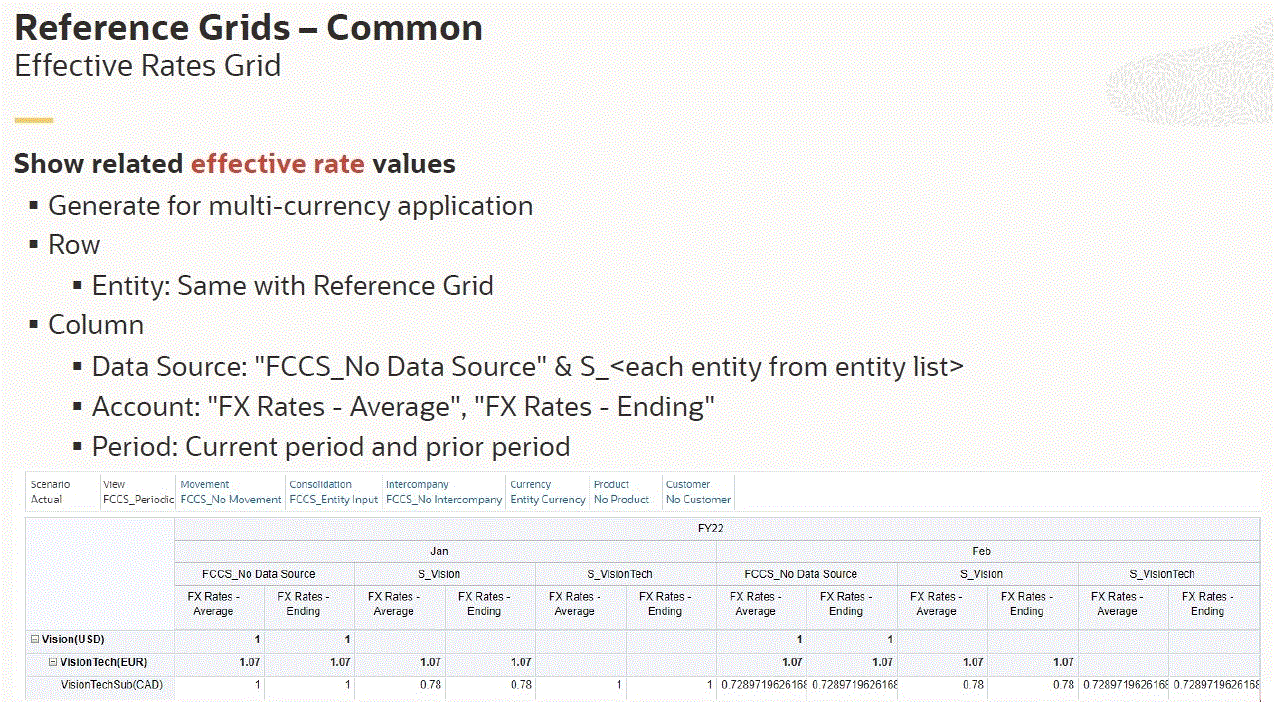
Effective Rates Grid
The Effective Rates Grid is generated along with the Reference Grid, if multi-currency is enabled.
ICP Variance Grid
The ICP Variance Grid is generated along with the Reference Grid for Intercompany Account or Plug Account.
The grid is designed for cross-checking values between Intercompany Account and Plug Account.
In the columns, Plug Account is displayed in the first column followed by all corresponding Intercompany Accounts.
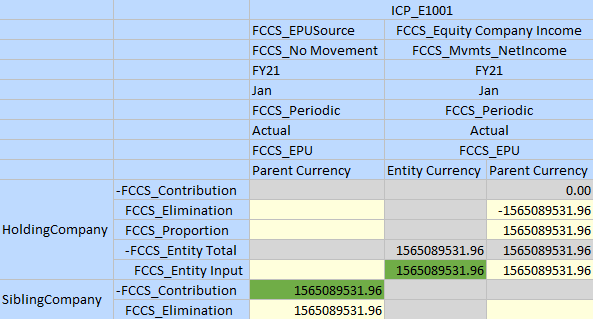
EPU Variance Grid
The Equity Pickup Variance Grid is generated along with the Reference Grid, if Equity Pickup is enabled.
The grid is designed for cross-checking values between Equity source and destination accounts.
Output in Cell Attachments
Data Discovery Notes
Every time you run Data Discovery, the Data Discovery Note#<Sequence Num>.txt text file is generated and attached to the cell.
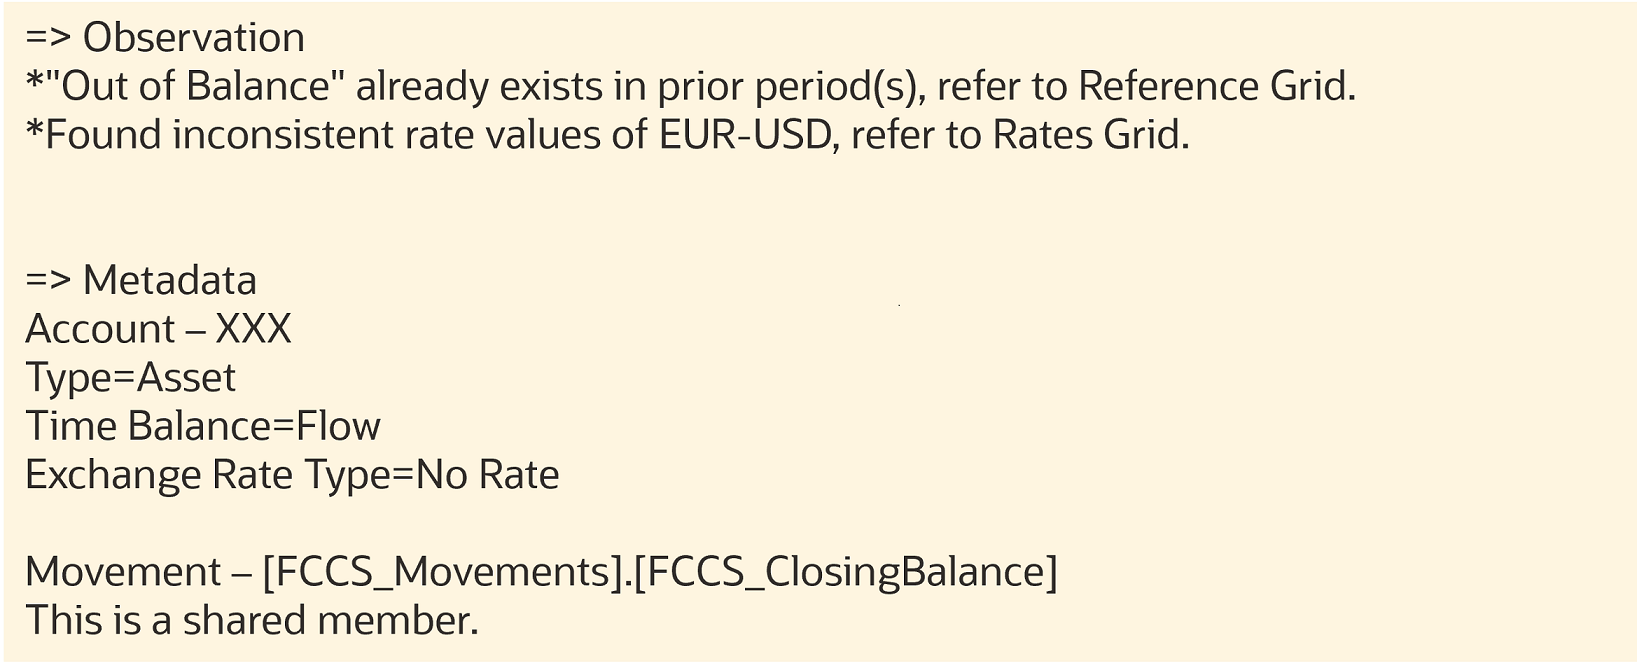
- Observation: system-generated messages.
The Observation section will include information on cells that are affected by Configurable Consolidation or Translation Override rules.
Examples:
Below Config
                        Consol Rule(s) could be the source of the value, please review: Disposals
                        Adjustment/Disposals Adjust
Below Translation Override Rule(s) could be the source of the value, please review: TransOverride for Cash account/FX Rates - Ending/Periodic/Replace - Metadata: List of metadata information for the Account, Movement, Entity
dimensions as reference.
For the Account dimension, the key properties are listed.
For all three dimensions, the system detects whether the member is a shared instance or has shared instances.
Calculation Trace
To generate calculation trace for a cell:
- From the Home page, click Navigator, then under Tools, select Data Discovery.
- On the Data Discovery page, click Settings.
- Select Enable Calculation Trace.
- Run Data Discovery on a non-dynamic cell. The cell must be updatable.
Note that this will trigger a single entity Consolidation.
When you generate the calculation trace, two text files are generated as cell attachments:
- Calculation Trace#<Sequence Num>.txt
- Simplified Calculation Trace#<Sequence Num>.txt
Calculation Trace
The Calculation Trace attachment shares the same format as the original Essbase trace
file. See Trace Calculations.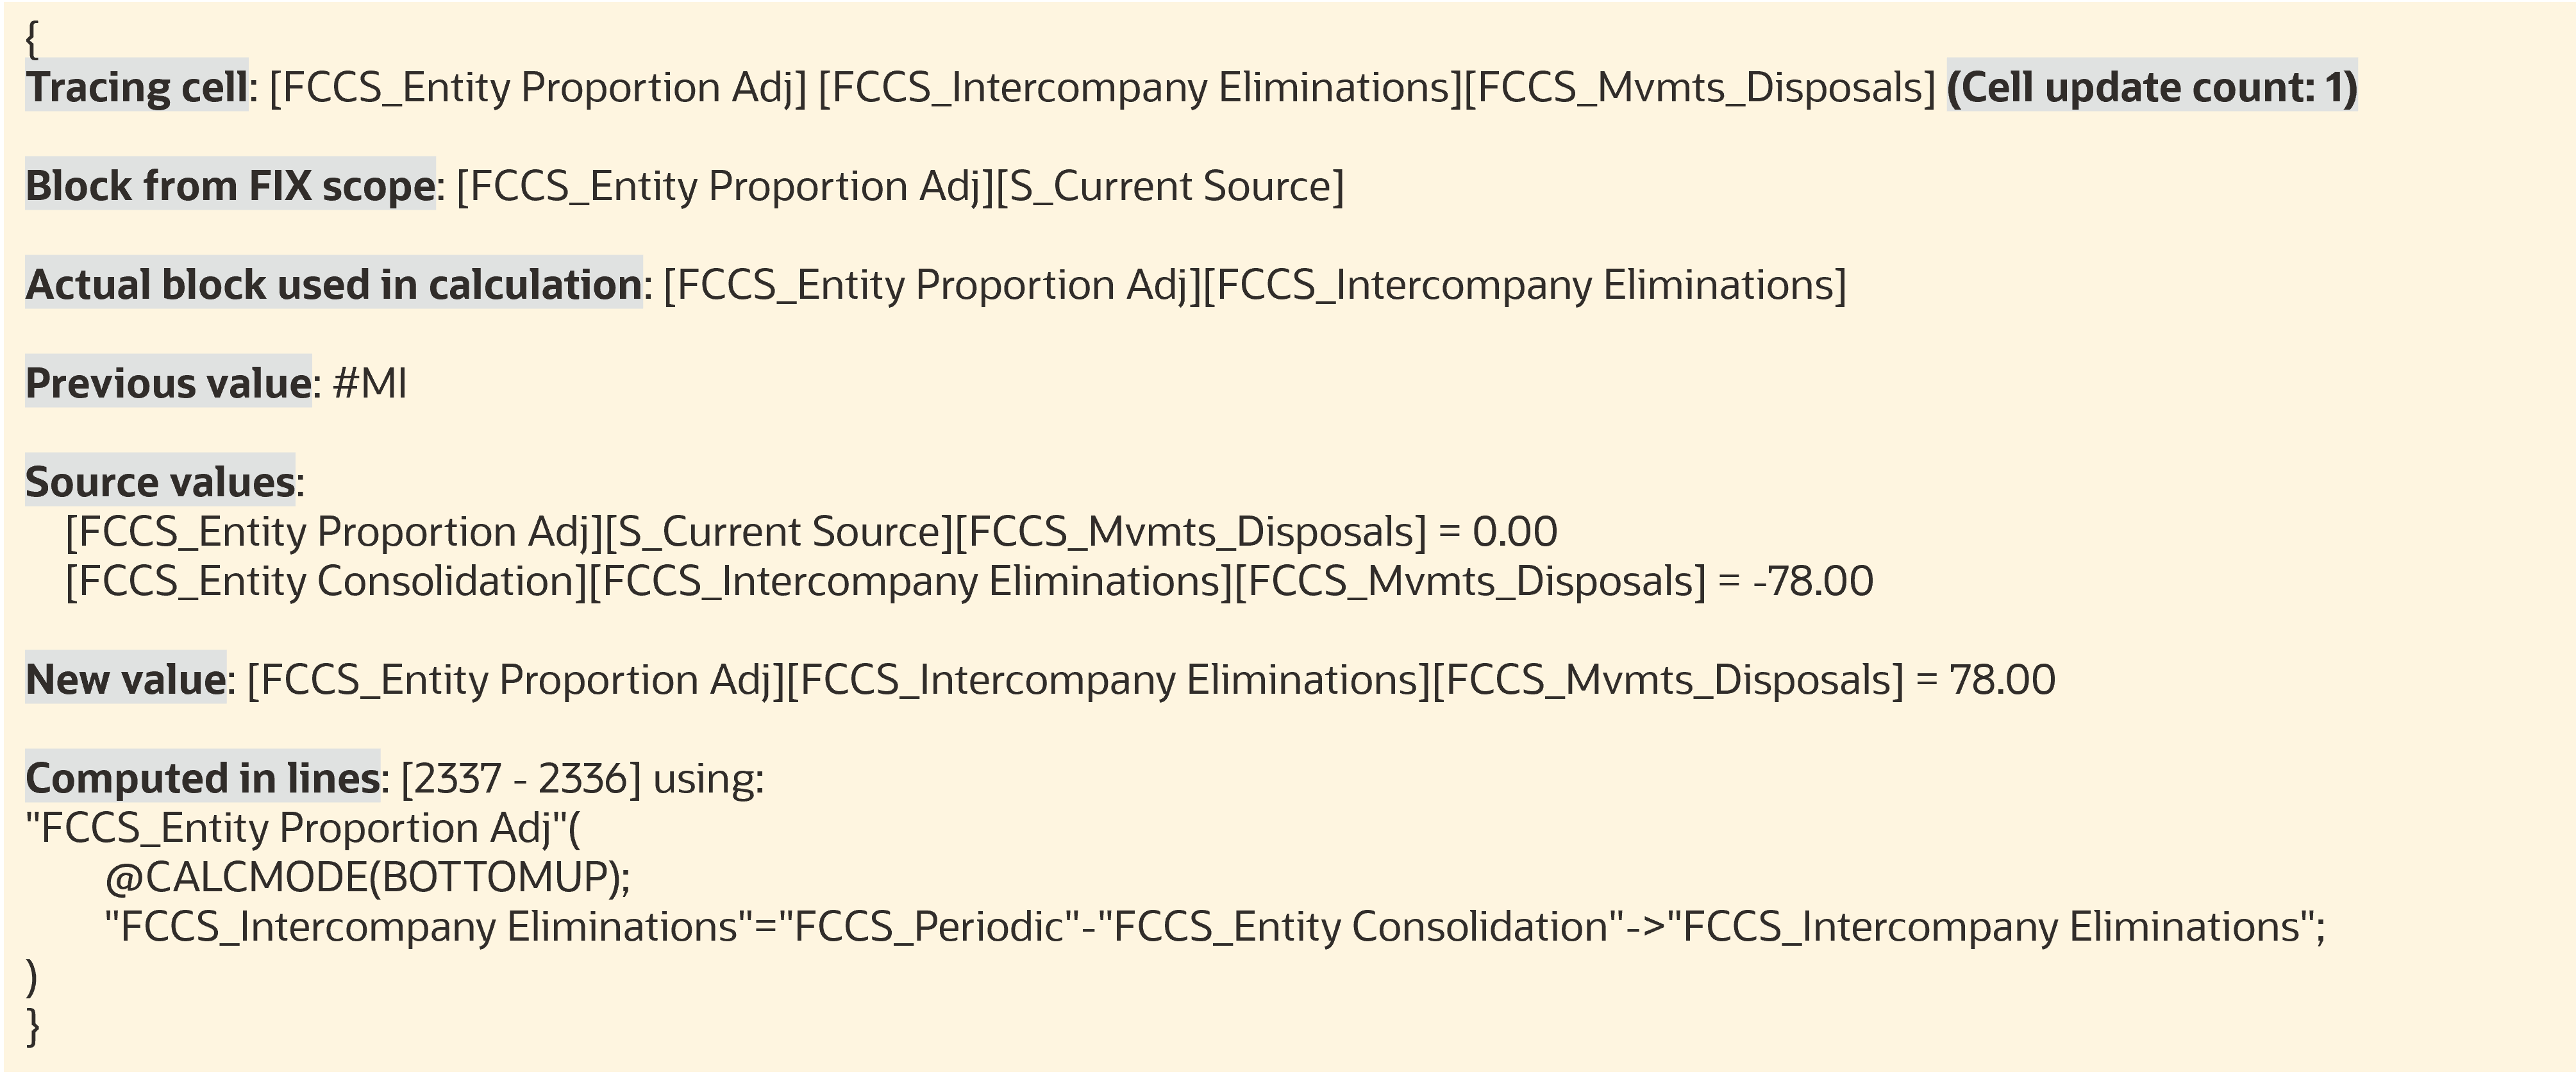
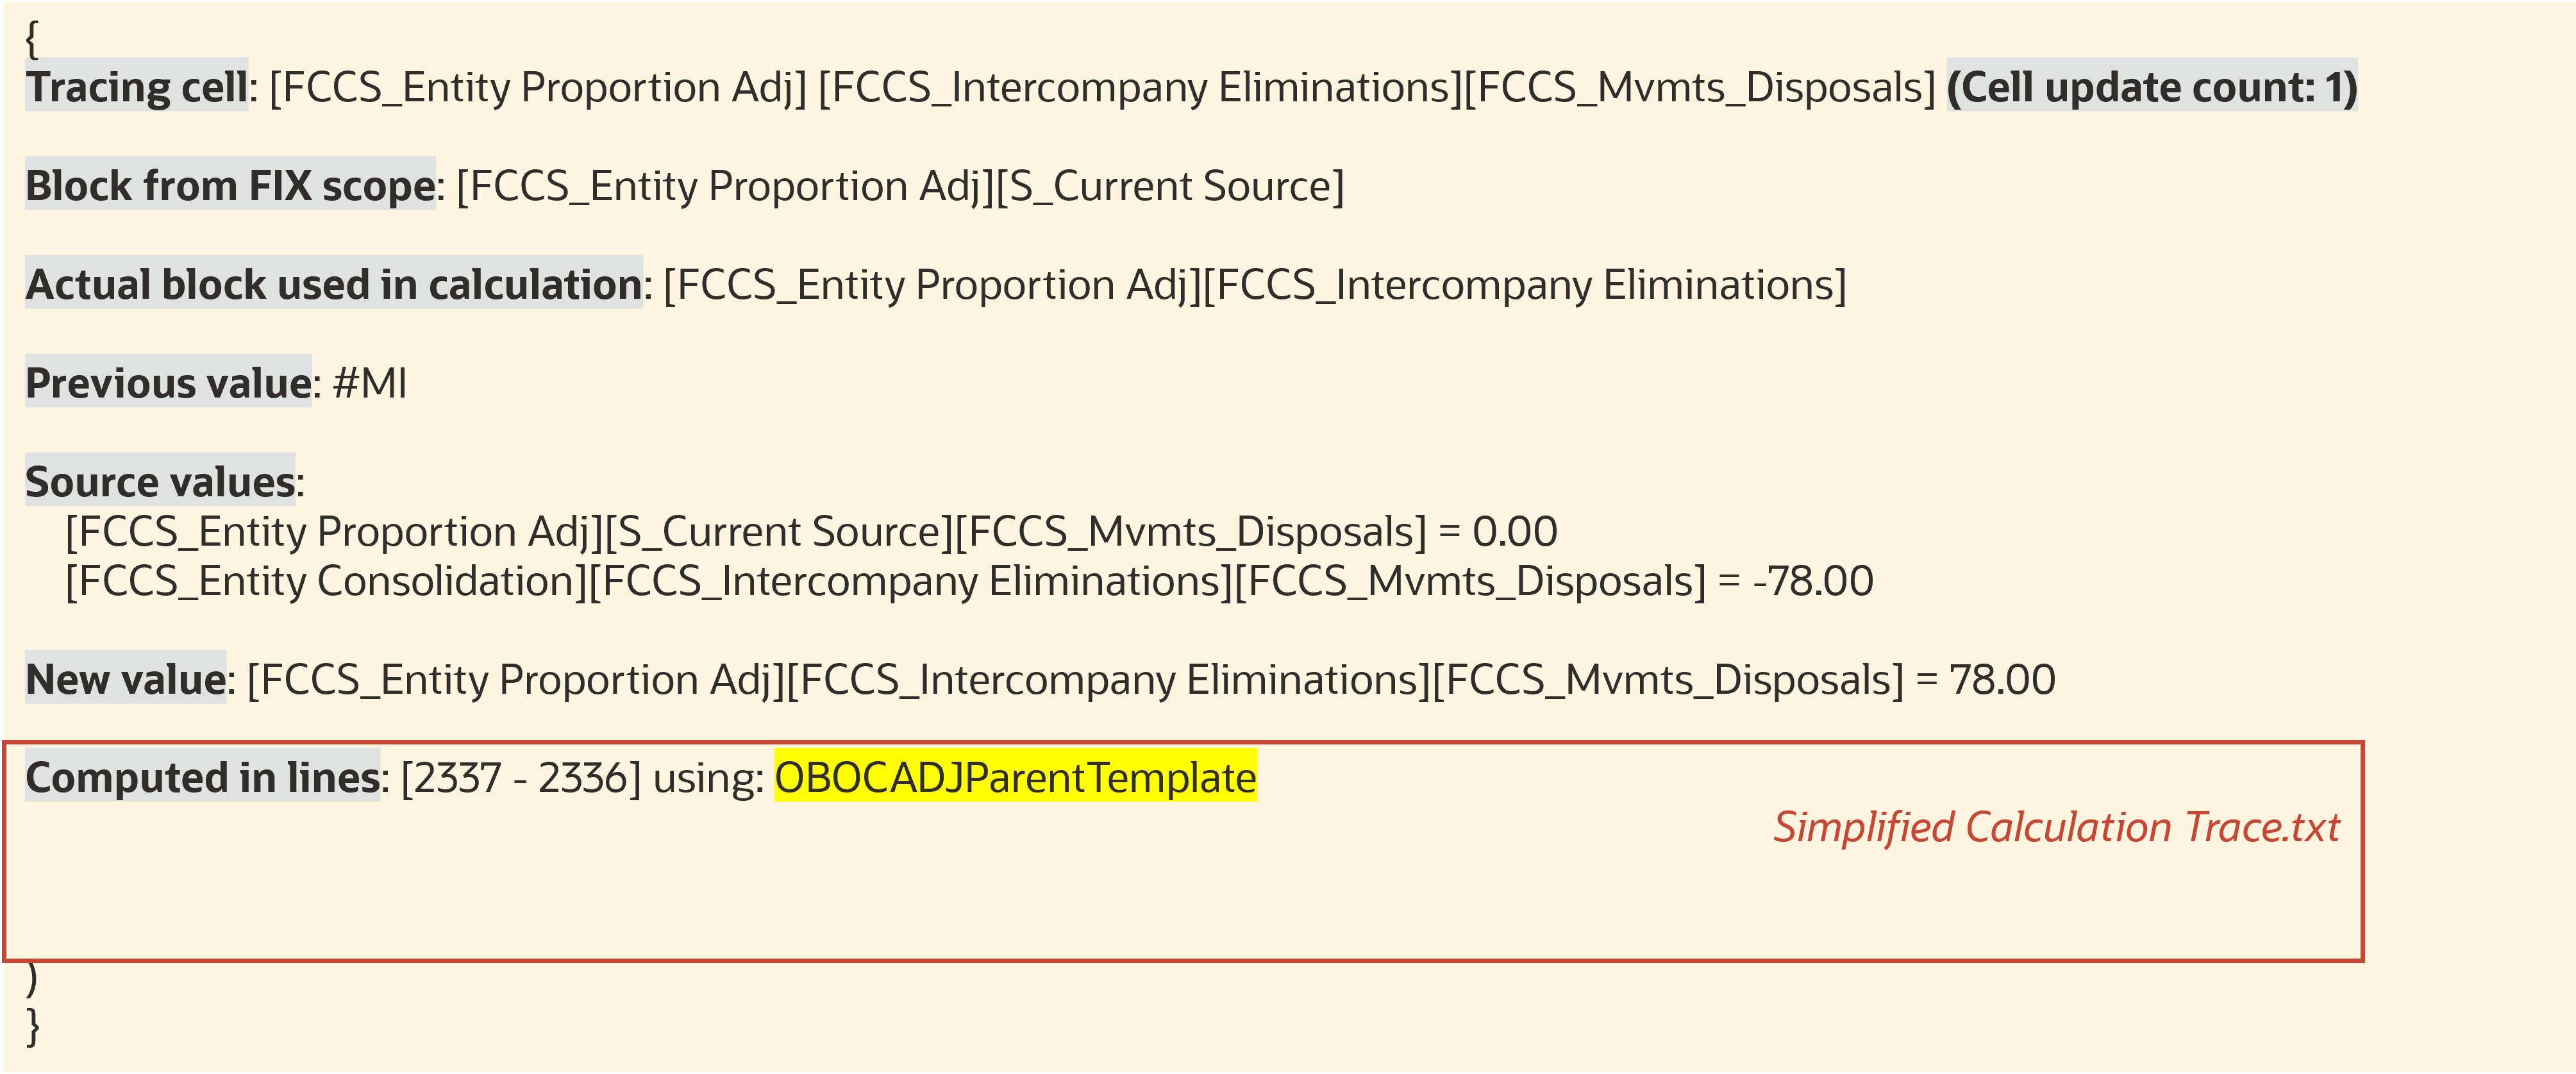
Simplified Calculation Trace File
The Simplified Calculation Trace attachment uses the Financial Consolidation and
Close consolidation template to replace the calculation scripts.