About the Insights Dashboard
The insights Dashboard helps you understand prediction accuracy and coverage trends.
The Insights Dashboard provides analytical reporting to view the trend of accuracy and coverage metrics. You don’t need to do anything to enable insights.
The Insights Dashboard provides the following categories of insights:
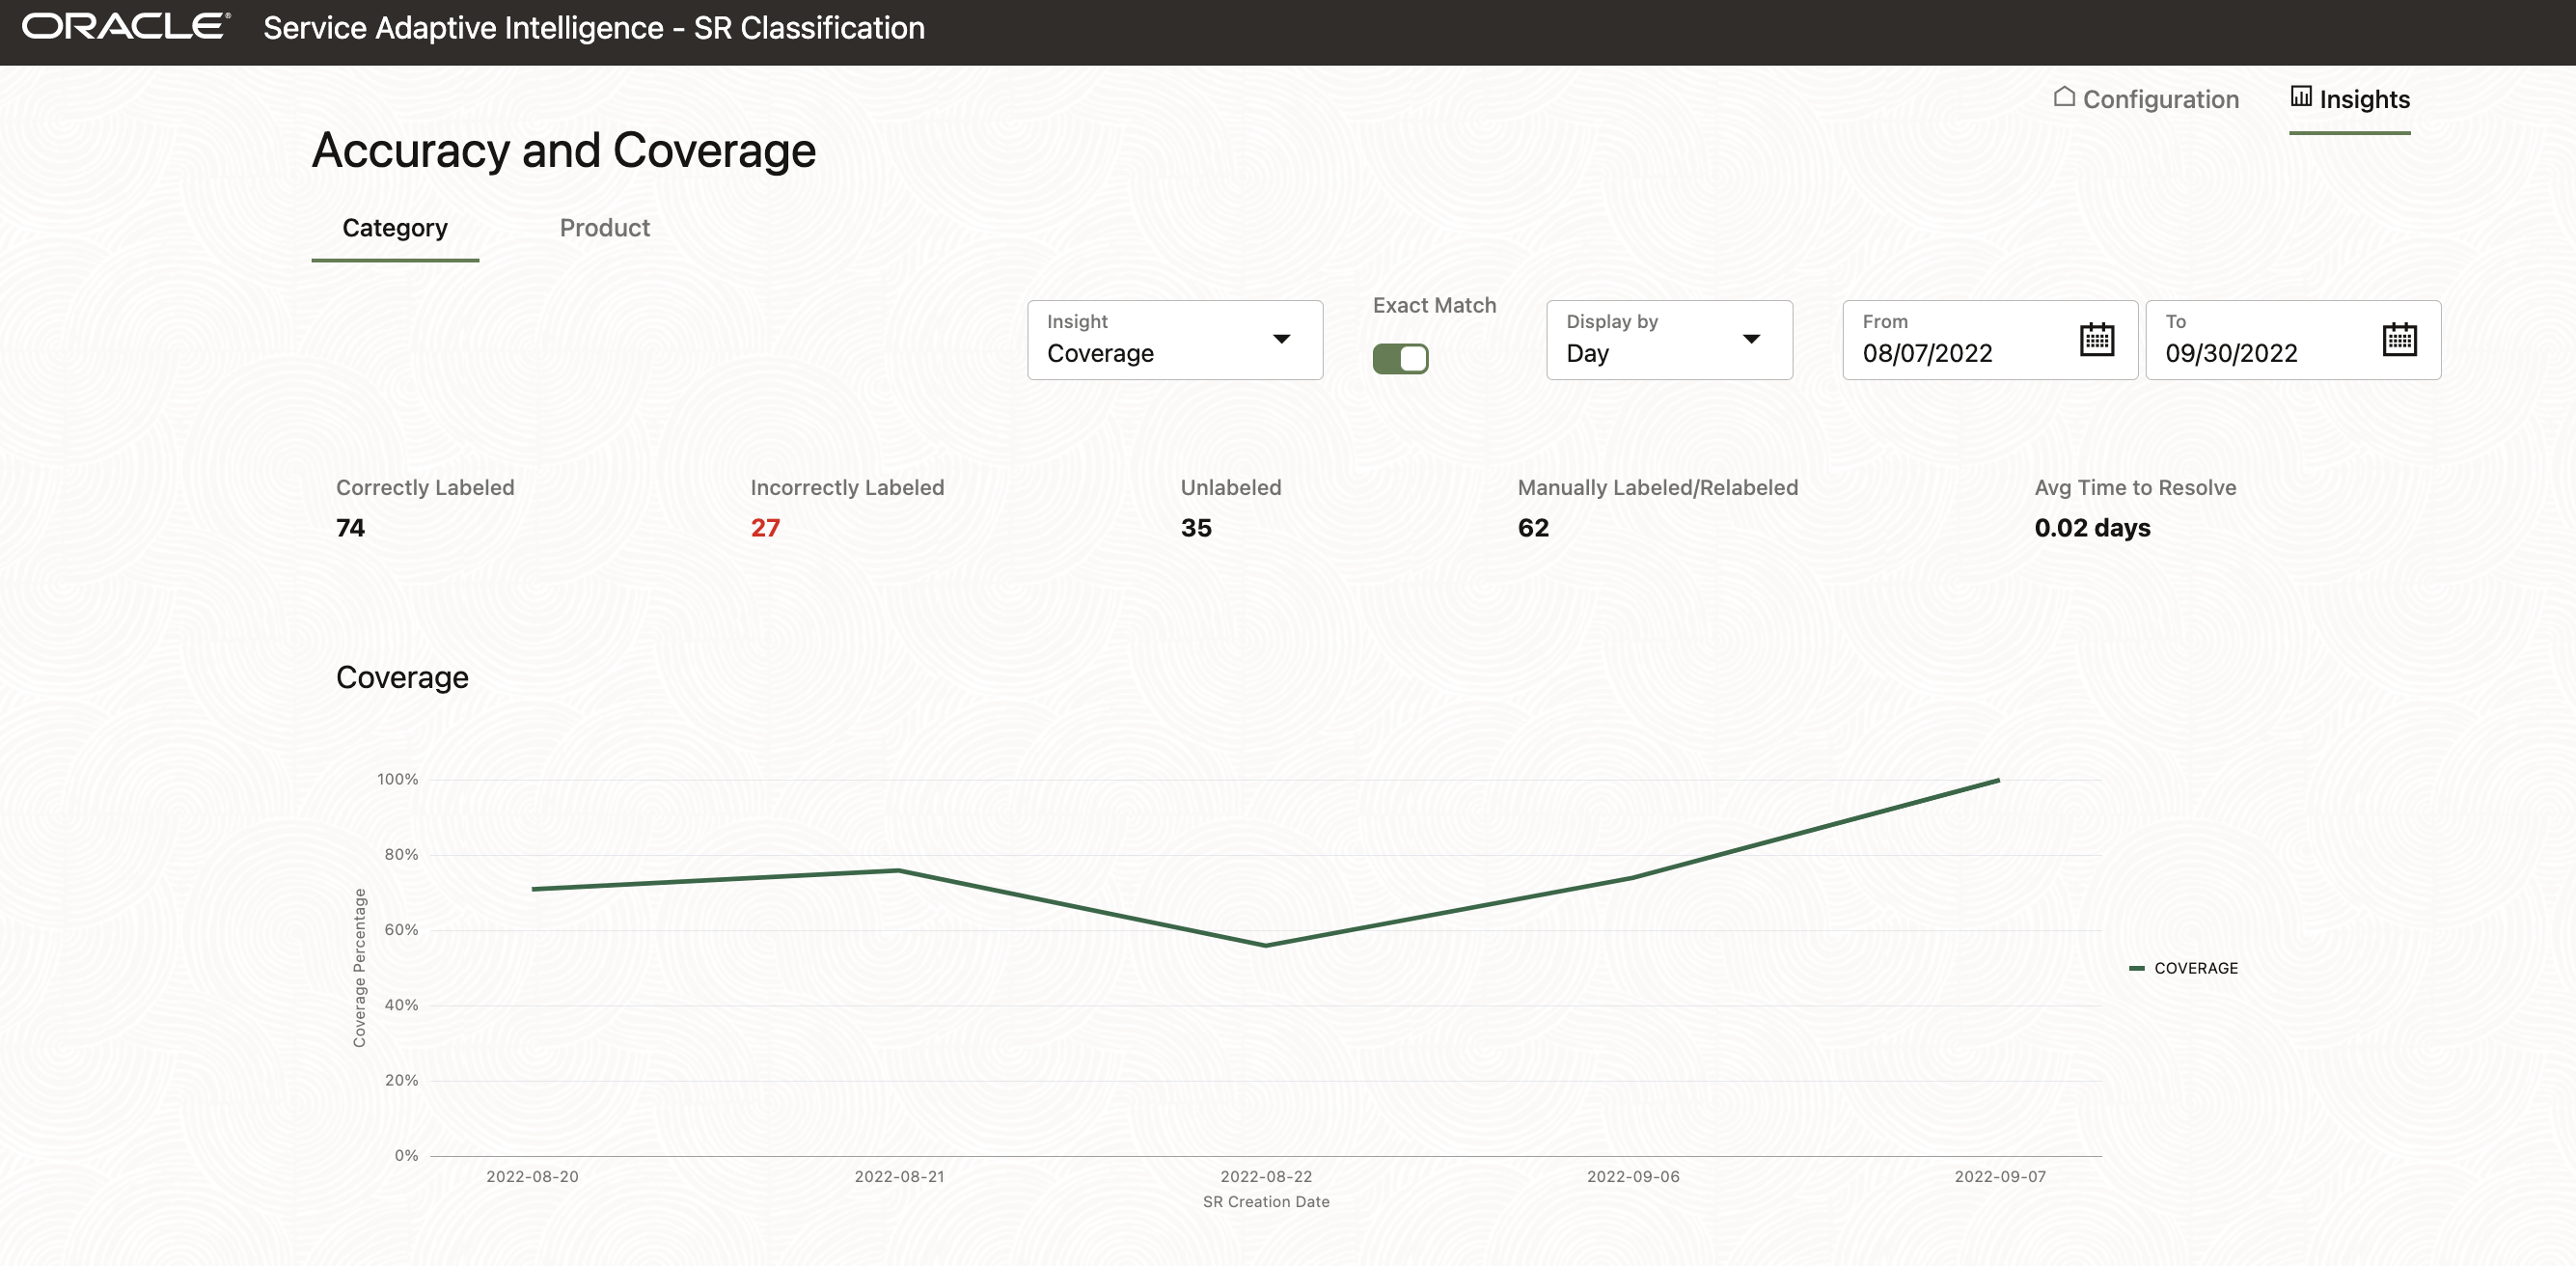
- Activity and Coverage Insights. Measured by the count of
requests that are labeled, not labeled, correctly labeled, or incorrectly labeled.
These insights trend over time to give you a grasp of their variation across days,
months, or years.
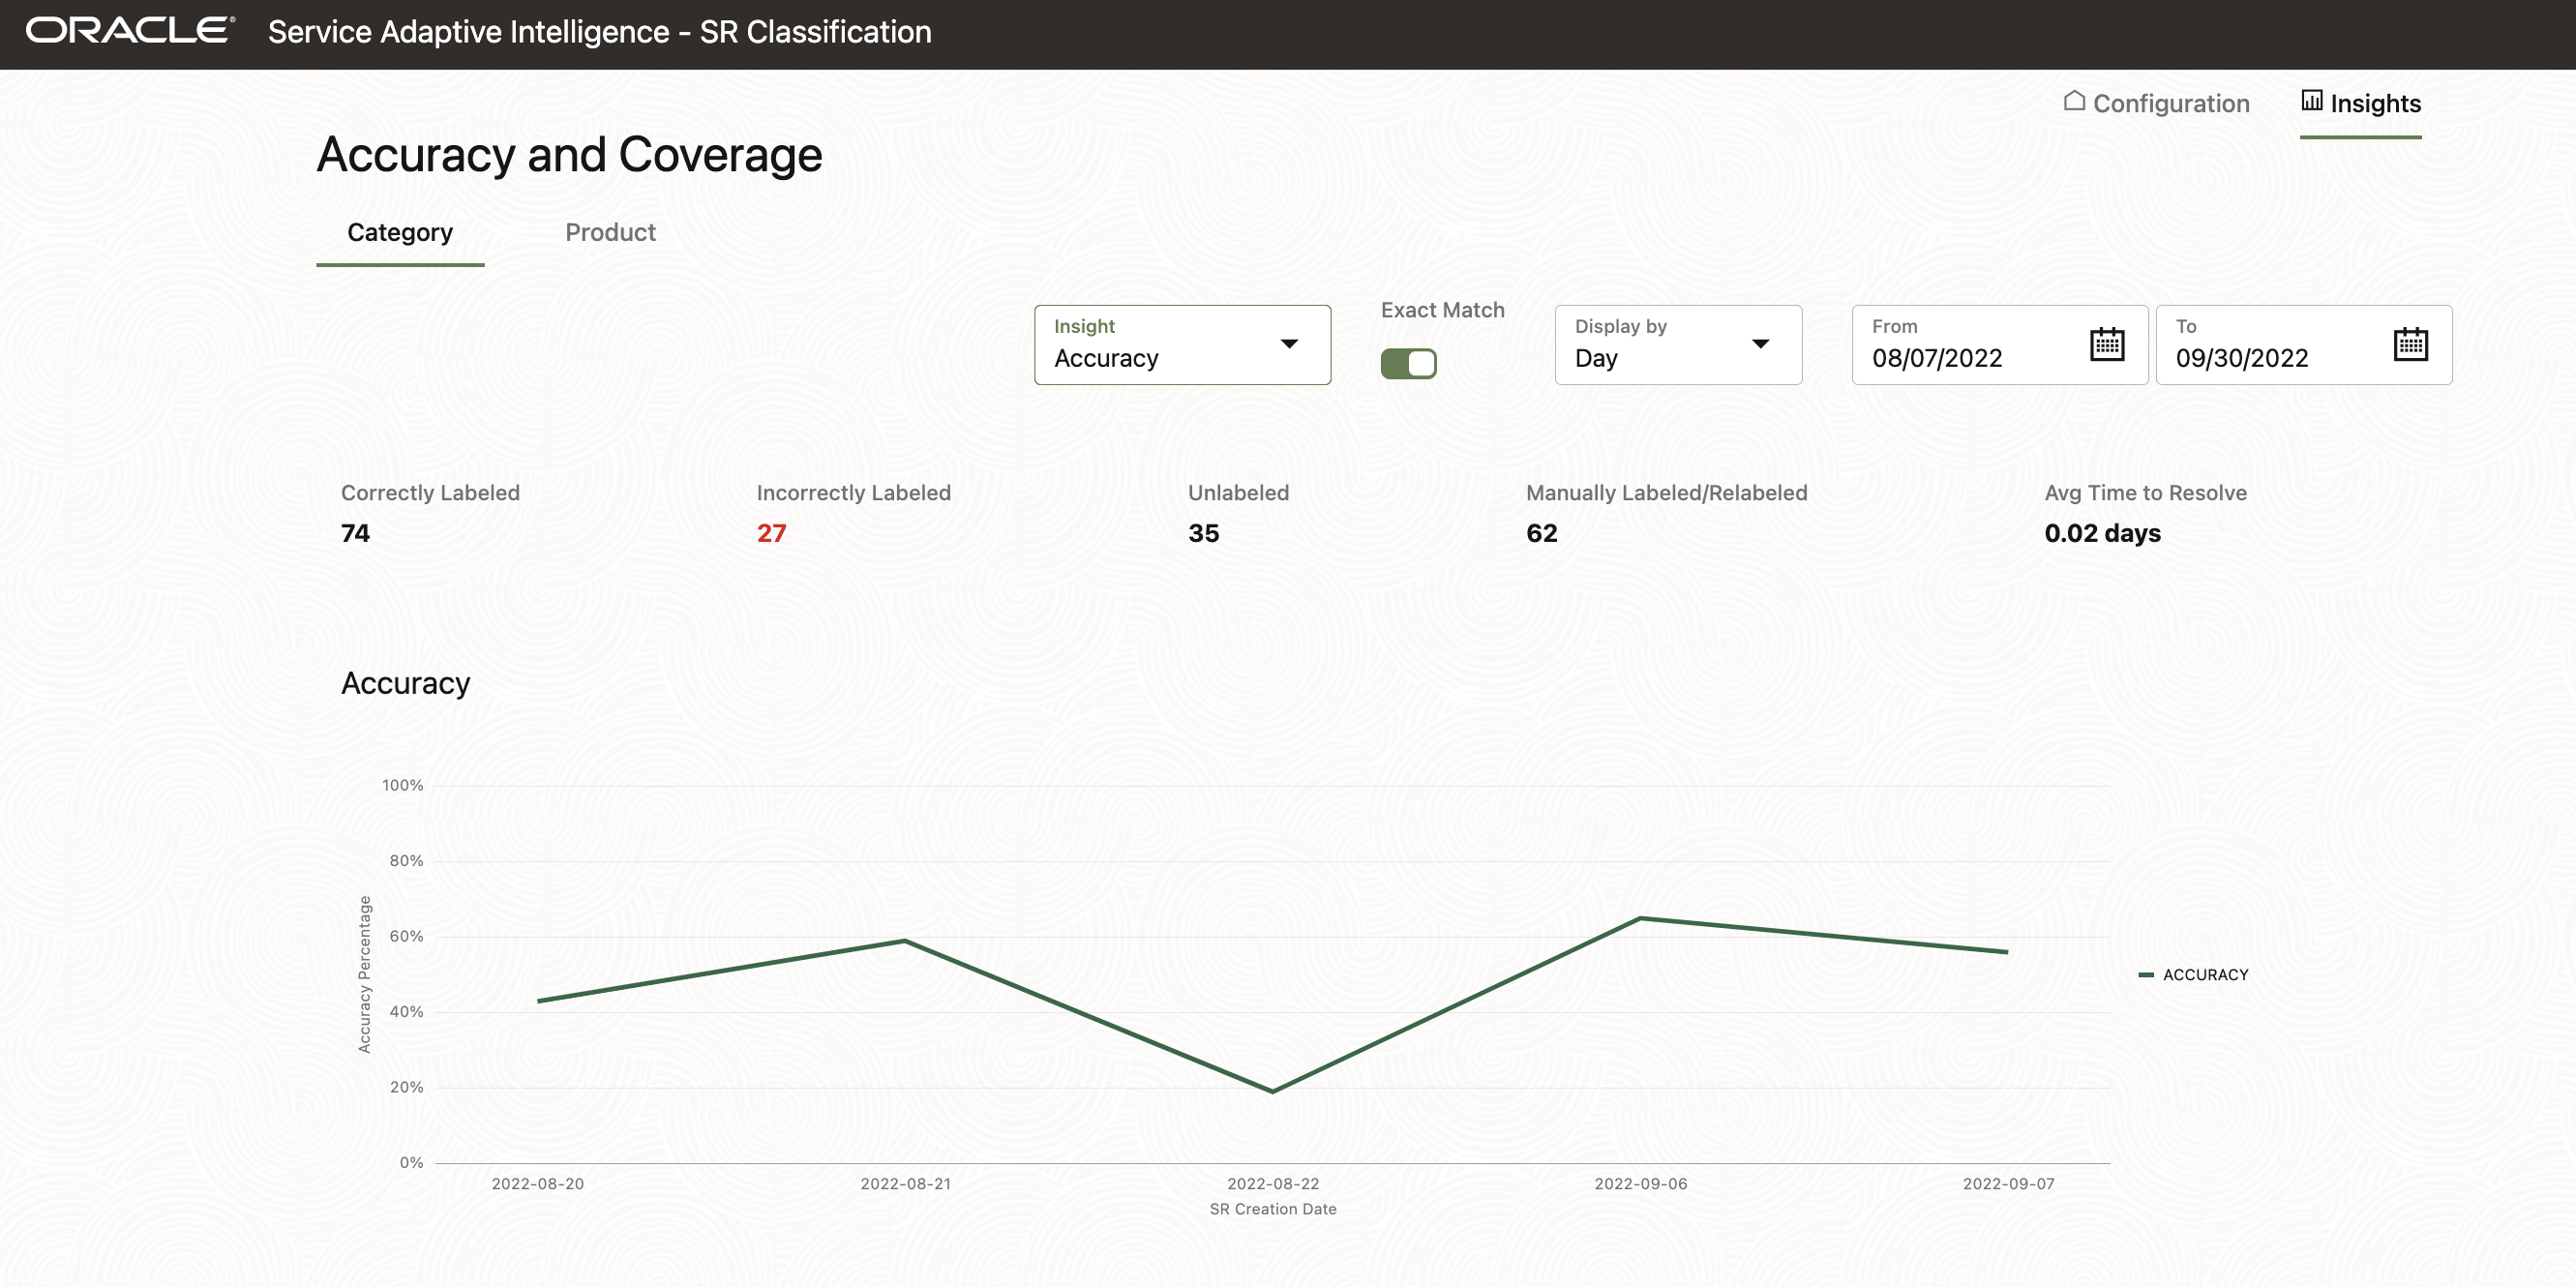
- Accuracy Insights. Measured by accuracy percentage. This is
the count of correctly labeled requests expressed as a percentage of total count of
requests labeled by AI. These insights trend over time to give you a grasp of their
variation across days, months, or years.
- Business Impact Insights. Measured by the average time to
resolve requests.
You can generate a graph by selecting the required filters.
Here are some key points about the graph:
- For each of the insights, the x-axis of the graph shows the timeline.
- The graph shows two different views of the data:
- In terms of actual volume of requests
- In percentages, which are a proportional view
- The overall number of closed requests is divided into different categories, and each of them is shown separately in the first line.
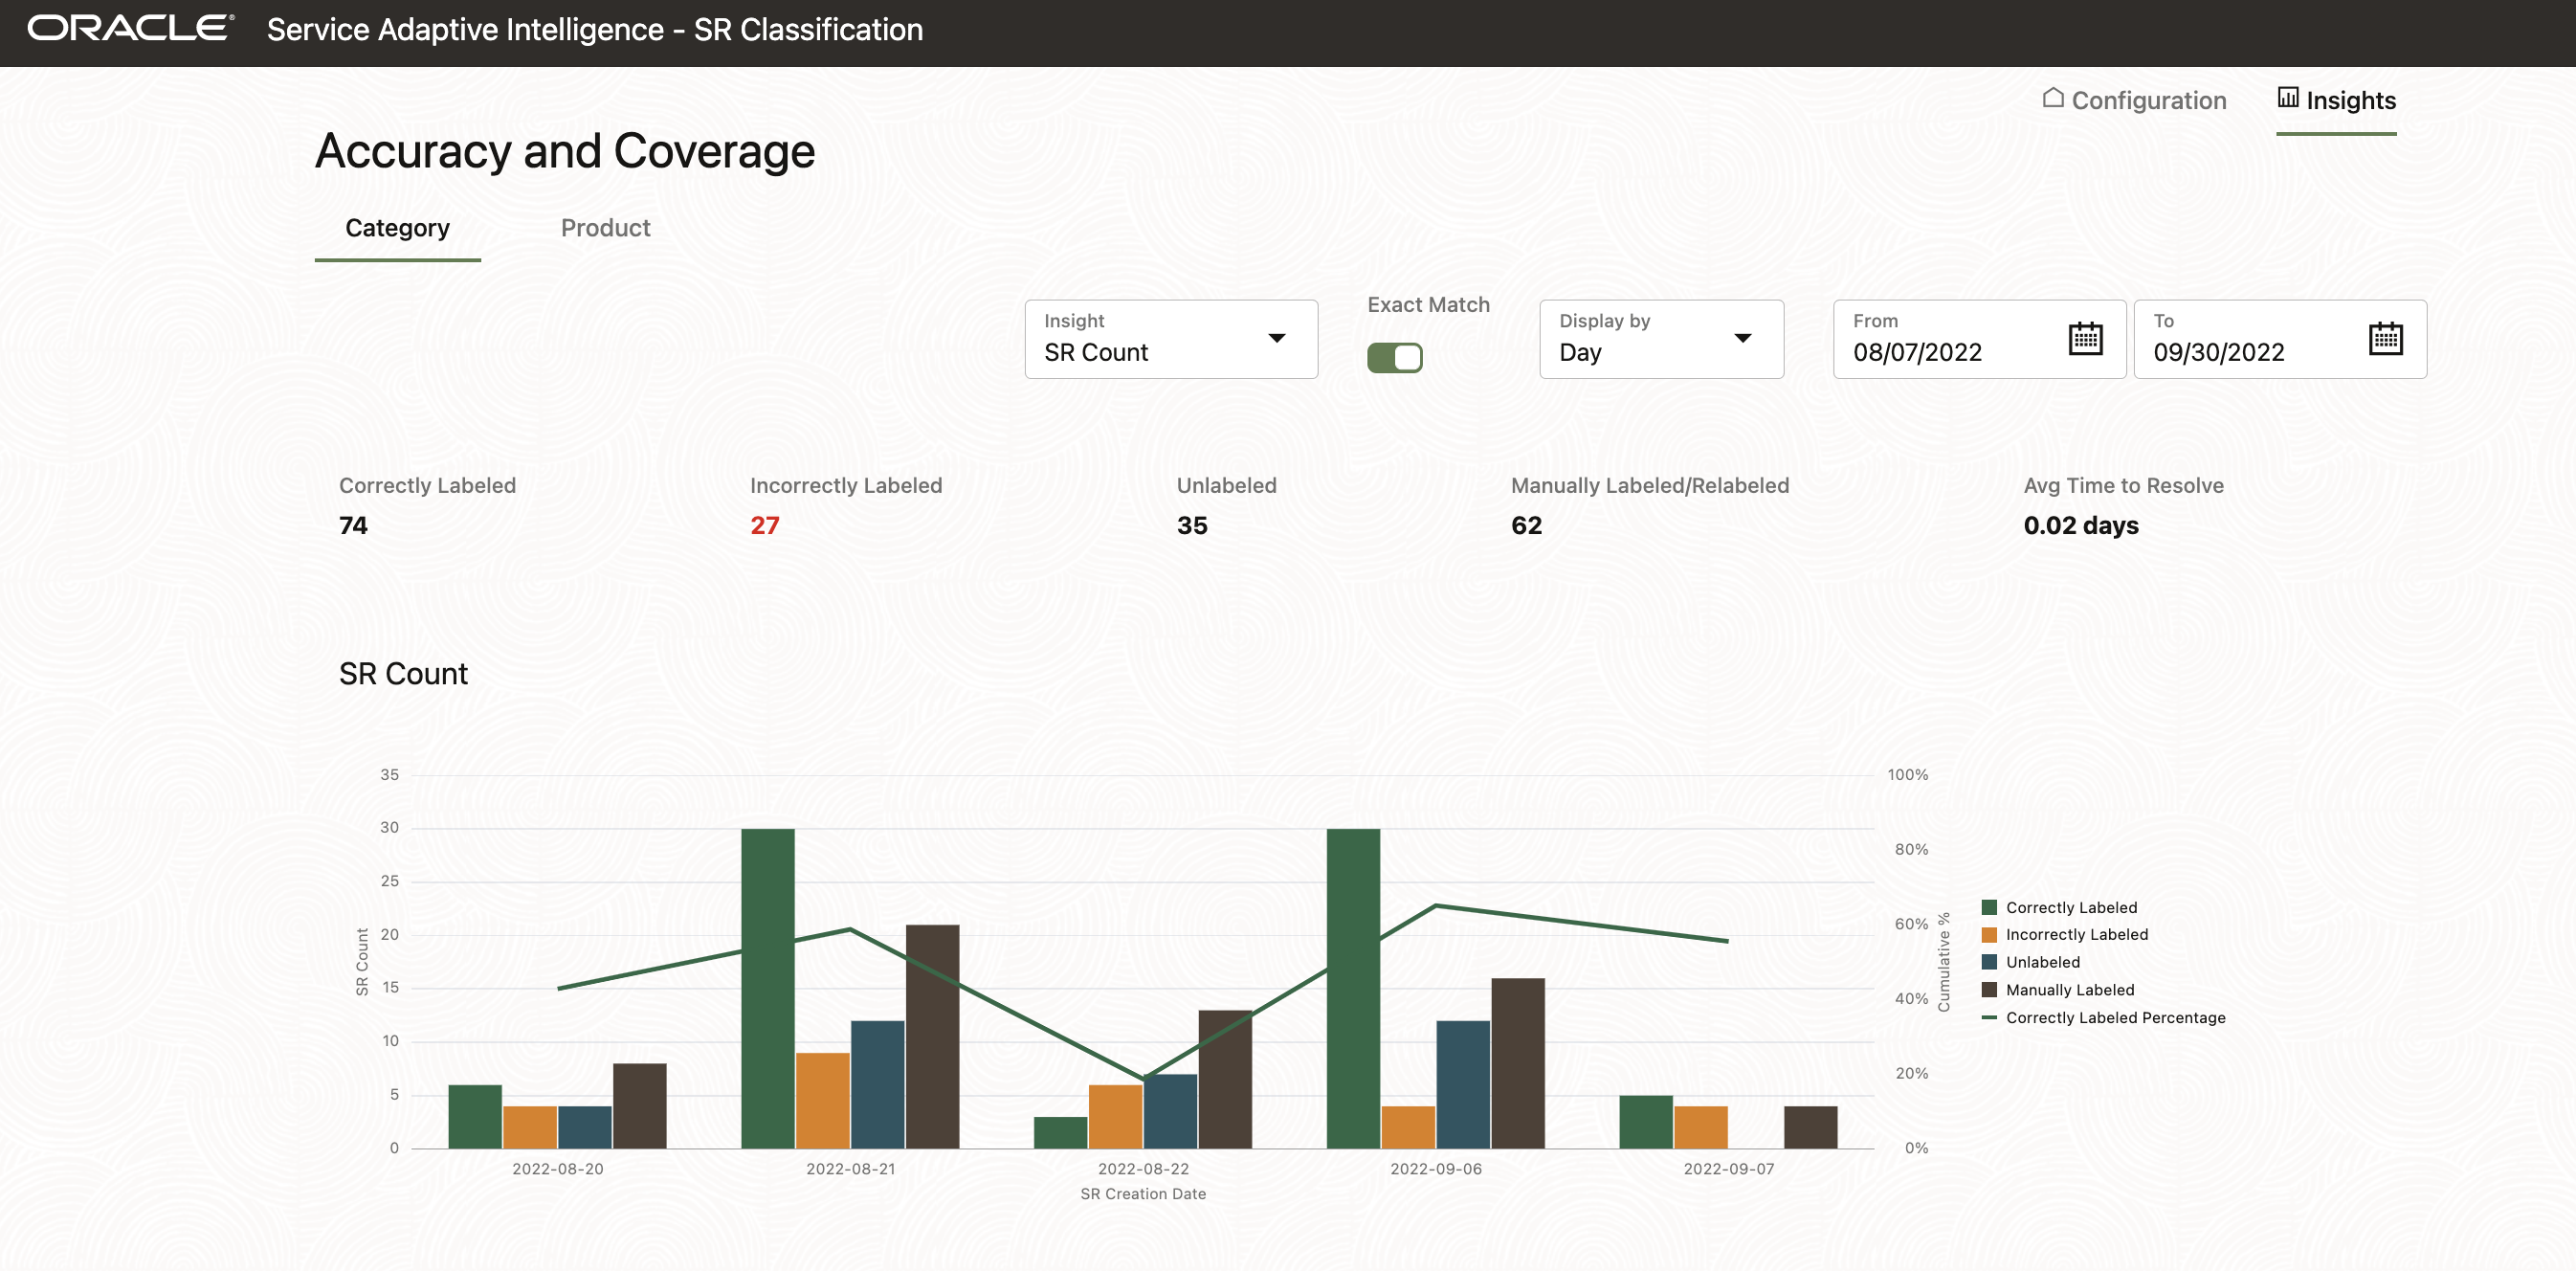
- The graph shows the following details:
- Correctly Labeled: Requests that were correctly labeled by the prediction service.
- Incorrectly Labeled: Requests that were relabeled by agents because the prediction service yielded an incorrect label.
- Unlabeled: Requests that remained unlabeled by the prediction service because the confidence was too low.
- Manually Labeled/Relabeled: These requests are a
combination of:
- Manually Labeled - Requests with no initial label, or unlabeled requests
- Relabeled - Incorrectly labeled requests
- Avg Time to Resolve: The average time taken to resolve requests that were classified using the prediction service.
Note: For the Activity and Coverage insight:
- The y-axis of the graph shows the request count and cumulative percentage.
- The line graph for the correctly labeled requests is also displayed. This graph denotes the percentage of correctly labeled requests averaged over the whole time period.