Service Infolets
Oracle Transactional Business Intelligence (OTBI) is a real time, self-service reporting solution bundled with your service application. It provides prepackaged analytic content built on the Oracle Business Intelligence (BI) platform.
Service Dashboard provides role based visibility into the most important service health key performance indicators (KPIs) affecting your organization, through a series of tiles or infolets. From the infolets, you can drill into the underlying detailed reports. From the infolets, you can drill into the underlying detailed reports.The infolet can also display an analytic such as a bar graph or a pie chart.
Drill into an infolet, and see, for example, the Critical Service Requests infolet which shows a list of individual SRs with their Reference Number, Title, Status, Assignee, and other relevant information. You can then navigate to individual records of the business objects displayed on a detailed report. For example, by clicking on the SR Reference Number you can navigate to the SR detail page and perform any updates to the SR and navigate back to the dashboard to resume analysis.The Service Dashboard can also be personalized to suit your preferences. Hide or show out of box infolets, or change the order of display of the infolets.
Here's how you navigate to the Service Dashboard page:
-
On the Home page, click the Service tab (callout 1 in the screenshot).
-
In the Quick Actions column, click Service Dashboard (callout 2).
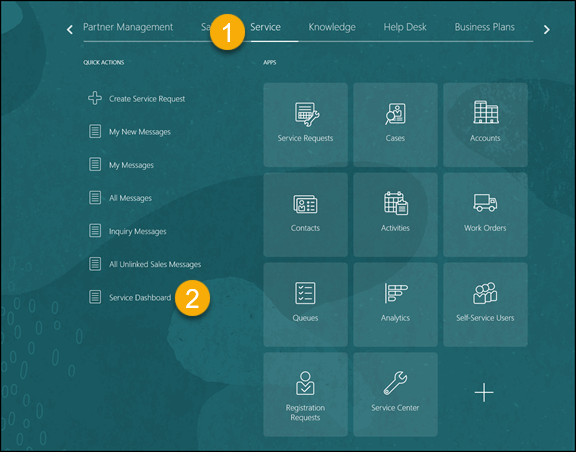
The Service Dashboard page is displayed.
If you're a customer service representative, you'll see the following infolets:
|
Infolet |
Description |
|---|---|
|
My Resolve Time |
Shows the average time you took to resolve assigned service requests over a 30 day period. It enables you to view that information against the average time taken by all agents to resolve service requests over the same period of time. |
|
Pending Tasks |
Displays the pending tasks that are assigned to you along with the priority (high, medium, or low) of each. You can also view tasks that are past their due date. |
|
Waiting on Customer |
Displays an overview of the service requests that are waiting on the customer. You can view the following information:
|
|
Waiting on Me |
Displays an overview of the service requests that are waiting on the user. The infolets contain the following information about the service requests waiting on the user:
|
If you're a customer service manager, you'll see the following infolets:
|
Infolet |
Description |
|---|---|
|
Agents with Most Pending Service Requests |
Displays the top-three agents that have the most pending service requests, and the number of service requests that are pending. Pending service requests are requests that are in New or In progress state, and are pending action by the agent. These requests don't include the requests that are waiting on the customer. |
|
Critical Service Requests |
Shows the average resolution time of the service requests resolved in the last 30 days, by any user in the signed-in service manager's team. |
|
Long Wait on Agent |
Shows the number of service requests that are waiting on the agent for longer than 24 hours. |
|
Queues by Unassigned Service Requests |
Shows the number of unassigned service requests in each queue. The graph also displays the priority of the service requests in the queues. |
|
Team Resolve Time |
Displays the average resolution time of the service requests resolved in the last 30 days, by any user in the signed-in service manager's team. The time is displayed in the number of days, hours, and minutes. |