Define an Automatic Anomaly

Define an automatic anomaly to automatically identify deviations from regular patterns.

Anomalies are created for asset types.
  1. Click Menu (Menu icon), and then click Design Center.
  2. Select Asset Types from the Design Center sub-menu.
  3. Select an asset type from the Asset Types list.
    You can also search for an asset type.
  4. Click Anomaly Detection.
  5. Click the Create Anomaly (Create Anomaly icon) icon.
    The Anomaly Detection Editor appears for the selected asset type.
    The anomaly detection that you define will apply to all assets of the chosen asset type.
  6. In the Details section, enter a name for the anomaly in the Name field.
  7. (Optional) Specify an optional Description text for the anomaly.
  8. (Optional) Select a value under Keep Metric Data For.
    If you have unique storage requirements for historical data related to this anomaly, you can select an option that is different from the global settings defined under Storage Management on the application Settings page.
    For example, if you are calculating anomalies across a large number of assets, and the anomaly data is not required beyond a month, then you can select 30 Days under Keep Metric Data For to optimize storage.
  9. Under Detection, select Automatic Anomaly as the Detection Method.

    Use an automatic anomaly to automatically look for deviations in sensor or metric (KPI) values. For example, automatic anomalies can help detect an HVAC device that is overheating intermittently.

  10. Select one or more available Target Attributes/Metrics to monitor.
    The list of attributes includes sensor attributes and query-type (computed) metrics.
    Select one sensor attribute or metric if you need to monitor anomalies in a single attribute or metric. Use multiple attributes only if you need to monitor anomalies caused by a combination of correlated attributes. Multivariate anomalies look for anomalies in correlated signals, and are more resource intensive.

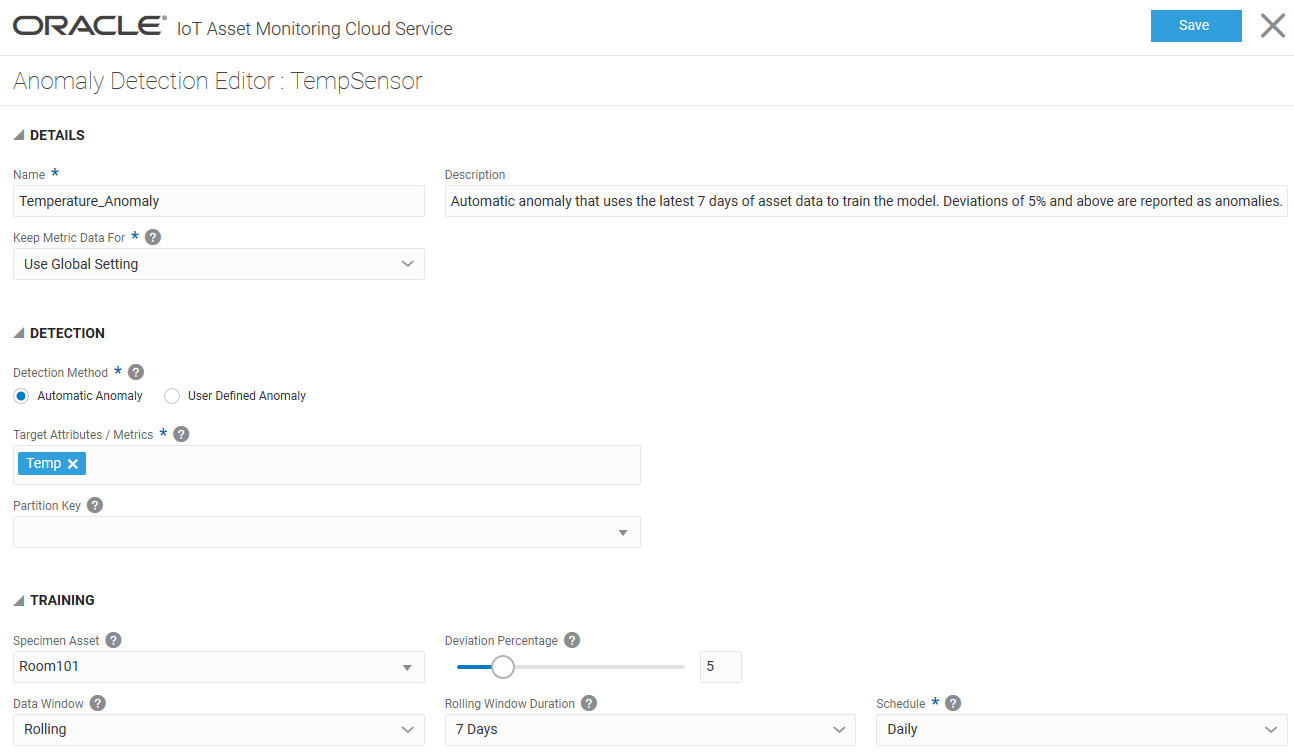
    The following example looks for anomalies in the temperature reading:


    Temperature Anomaly Example

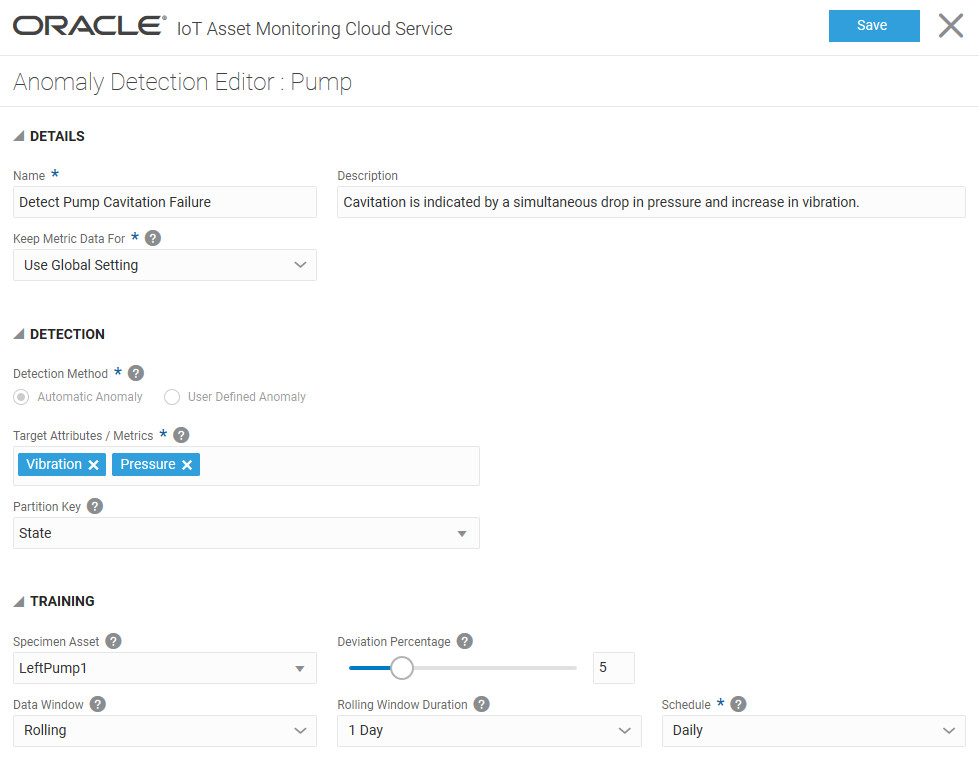
    The following multivariate example uses the Vibration and Pressure sensor attributes:


    Anomaly Detection Editor: Described in text.

  11. (Optional) If you have defined sensor attributes that can be used as partition keys to determine the asset state, then you can choose the Partition Key.
    For example, you may have defined a sensor attribute called State to determine whether the asset is currently running, idling, or under maintenance.

    Note:

    The asset type must have at least one sensor attribute that can be used as the partition key. See Create a New Asset Type for more information on sensor attributes.
  12. Under Training, select a Specimen Asset that provides the training data for anomaly detection.

    A list of all assets with the selected asset type appears. The asset with the most data is chosen by default. You can choose a different asset if required.

  13. Under Training, select a Deviation Percentage.

    Deviation percentage is the acceptable noise in your target attribute data. Use the slider to set a value, or enter a value manually.

    Automatic anomalies choose the best underlying algorithm depending on several factors, such as whether the anomaly uses one or more target attributes, whether the data distribution is Gaussian or non-Gaussian, and the number of records in the data set.

    If you have used a single target attribute or metric, and your data distribution is Gaussian or the number of data points is less than 5000, then the deviation percentage is the percentage deviation from normal distribution. Here, normal distribution implies mean of target attribute value plus/minus twice the standard deviation. Any percentage deviation beyond the deviation percentage results in anomalies.

    You can fine-tune your anomaly detection by looking at the reported anomalies and making any required adjustments to the Deviation Percentage. For example, if you are getting false positives, you may want to increase the deviation percentage, but if not all anomalies get flagged, then you may need to lower the deviation percentage value.

    If your data distribution is non-Gaussian, or if the number of data points is large, or if you are using multiple target attributes or metrics, then an appropriate threshold-based algorithm is chosen to detect automatic anomalies. For such cases, deviation percentage is the threshold deviation percentage. Note that you may need to tweak your deviation percentage value in case you are getting false positives, or in case not enough anomalies are being reported.

    Note:

    Do not use random data when testing your anomalies. If using simulated test data, do not use random patterns. Note that range-binding simulated data is not enough to make it non-random. Threshold-based algorithms cannot work with random data.
  14. Under Training, select the Data Window.

    The Data Window identifies the data set that is used to train the system for anomaly detection.

    • Static: Uses a static data window to train your anomaly model. If you have golden data from a period when your asset worked normally, you can use the same to specify a static window. Select the Window Start Time and Window End Time for your static window period.

      The static data window provides data for a one-time training of your anomaly model. If your definition of normal data changes in the future, you should edit the Data Window for the automatic anomaly, so that the model can be re-trained.

    • Rolling: A rolling data window uses data from a rolling time window to pick the most recent data for training. For example, you can choose to train your anomaly model with a rolling data window of the last 7 days, and choose to perform the anomaly training daily.

      When you use a rolling window, the training model is re-created periodically, as determined by the schedule frequency that you choose.

      • Rolling Window Duration: The duration of the rolling window going back from the model training time. For example, if you select 7 Days, then the last 7 days of specimen asset data is used to train the anomaly model.
      • Schedule: The frequency of the anomaly model training. For example, if you choose Daily, then the training happens every day at 00:00 hours (midnight), UTC time by default.
  15. Click Save.
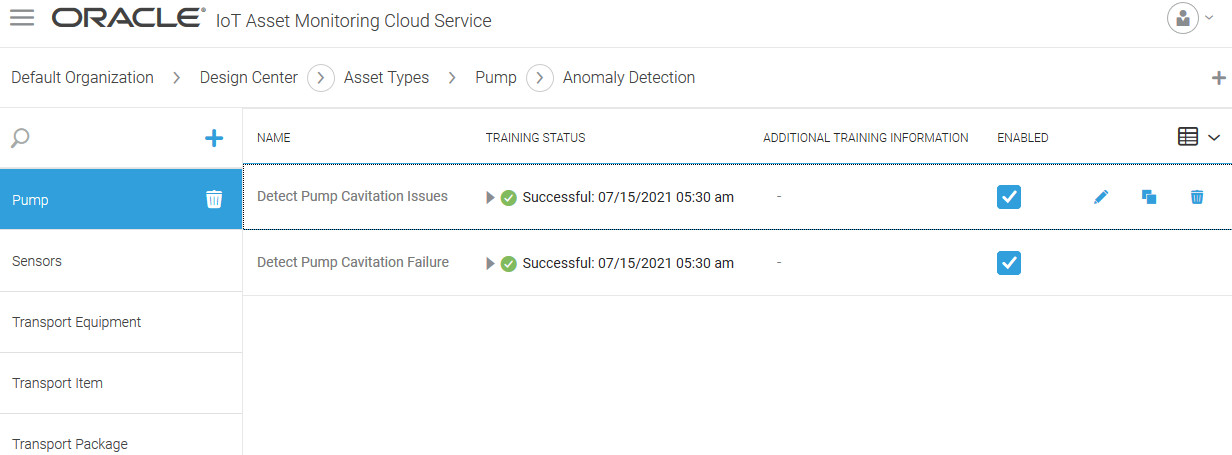
The anomaly is added to the Anomalies page. The Training Status column shows the latest training status for the anomaly model. Once training is complete, the application starts detecting and reporting anomalies.
Anomalies showing completed training timestamps

The application reports completed model trainings along with their timestamps. If training fails, the application includes pertinent information related to the failure. For example, the chosen training data set's statistical properties might not be suitable. The Feedback Center is also used to notify the Asset Manager about failures.

You can enable or disable an anomaly from within the Anomaly Editor.