Use Anomalies to Track Deviations in Asset Behavior
When the set parameters of an asset do not conform to a regular pattern, an anomaly occurs. An anomaly can help you identify and resolve potential problems with your assets.
Use anomalies to detect deviations from normal asset behavior, and to flag and address device issues in time. You can define the following types of asset anomalies in Oracle IoT Asset Monitoring Cloud Service:
-
Automatic Anomaly: Use an automatic anomaly to automatically look for deviations in sensor or metric (KPI) values. For example, automatic anomalies can help detect an HVAC device that is overheating.
Sometimes, a set of correlated sensor signals can help identify issues with your asset. For example, a drop in pressure readings coupled with an increase in vibration may indicate cavitation issues in a pump. You can use multivariate automatic anomalies to monitor multiple sensor attributes and metrics simultaneously. Use the Operations Center to view the reported anomalies on the timeline, together with the key signals from your chosen sensor and metric attributes.
Asset sensor values can depend on the asset state. For example, an idling motor has different vibration measurements from a motor running with load. Asset sensor values may also vary with the current process, product or environmental attributes. For example, the baseline fuel consumption may depend on the ambient temperature. The injection pressure of a molding machine may depend on whether it is currently molding steel or aluminum bottles.
If the current asset state determines the threshold sensor values for your anomalies, you can use partition key attributes to partition your anomalies. For example, you can create partitions to look at vibration anomalies when the motor is working, and ignore states where the motor is idling, or under maintenance.
-
User-Defined Anomaly: Create a user-defined anomaly to look for telltale patterns in sensor or metric data generated by an asset. For example, you may create user-defined anomalies to look for vibration anomalies in a forklift asset. User-Defined anomalies are based on acceptable or anomalous data patterns. You train the system by providing it with samples of acceptable data or anomalous data. These samples can come from sensor data, user-defined patterns, and contextual data stored in external systems.
For acceptable data, you specify a time window containing acceptable patterns of sensor or metric data. The time window is a period of typical operations during which your assets, and associated sensors, behaved normally. The system uses the data pattern that you select to train itself. During day-to-day operations, the system looks out for deviations in data patterns that are beyond the specified deviation percentage, and flags these as anomalies.
For anomalous data, you can use IoT sensor or user-defined data to supply the patterns. You can also use contextual data sources. For example, if you have your breakdown event data stored in a Database Classic Cloud Service table, you can overlay these events on the sensor data timeline to define anomalies that occur around the breakdown events.
All detected anomalies appear on the Anomalies ![]() page accessible from the Operations Center or Asset Details page of individual assets. The anomalies displayed in the Operations Center depend on your current context (organization, group, subgroup, or asset).
page accessible from the Operations Center or Asset Details page of individual assets. The anomalies displayed in the Operations Center depend on your current context (organization, group, subgroup, or asset).
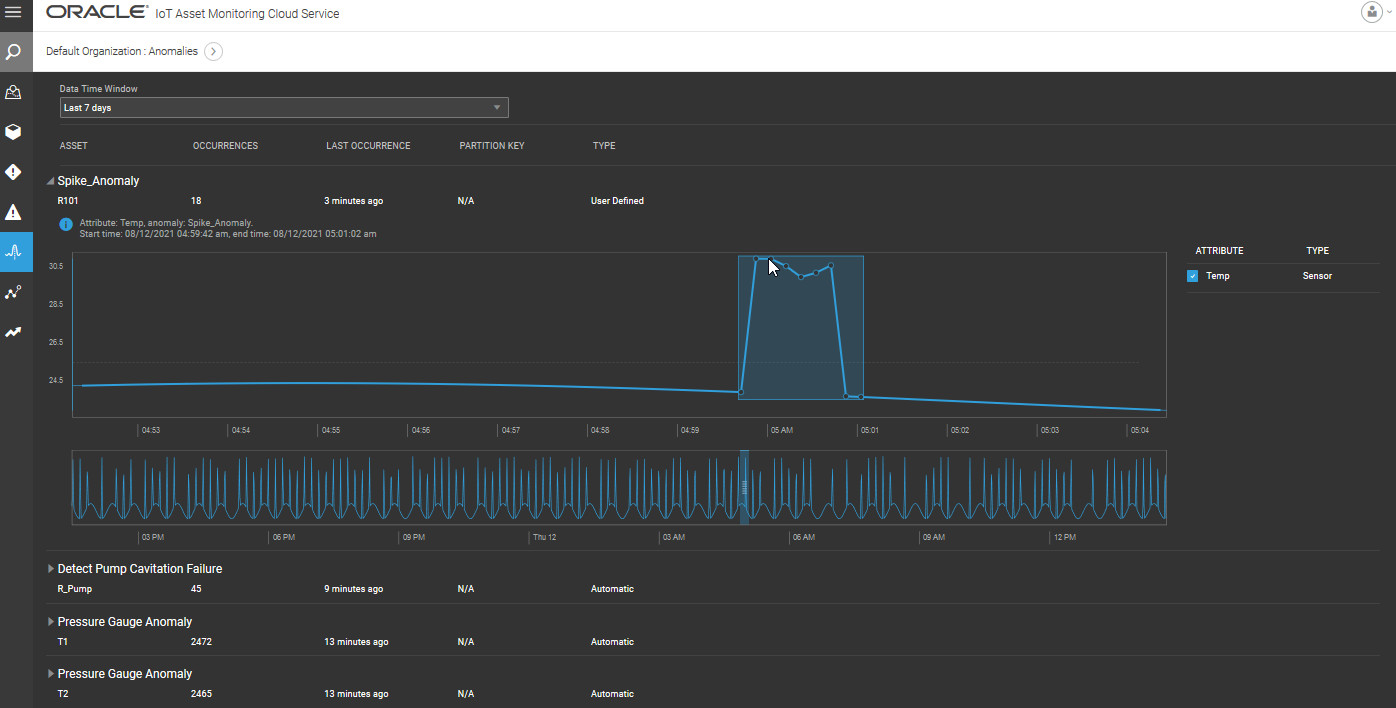
The following image shows some anomalies for the organization context in the Operations Center view. Anomalies for different assets are shown on the same page. You can change your context using the breadcrumbs in the Operations Center. You can filter your view for a group, subgroup, or individual asset.
Select a Data Time Window to look for anomalies that occurred during the selected period. Expand the anomalies section reported for an asset, and select the desired region in the lower chart to see a magnified version in the upper chart. You can move the mouse over an anomaly to view more details, such as the Start Time and End Time for the anomaly.

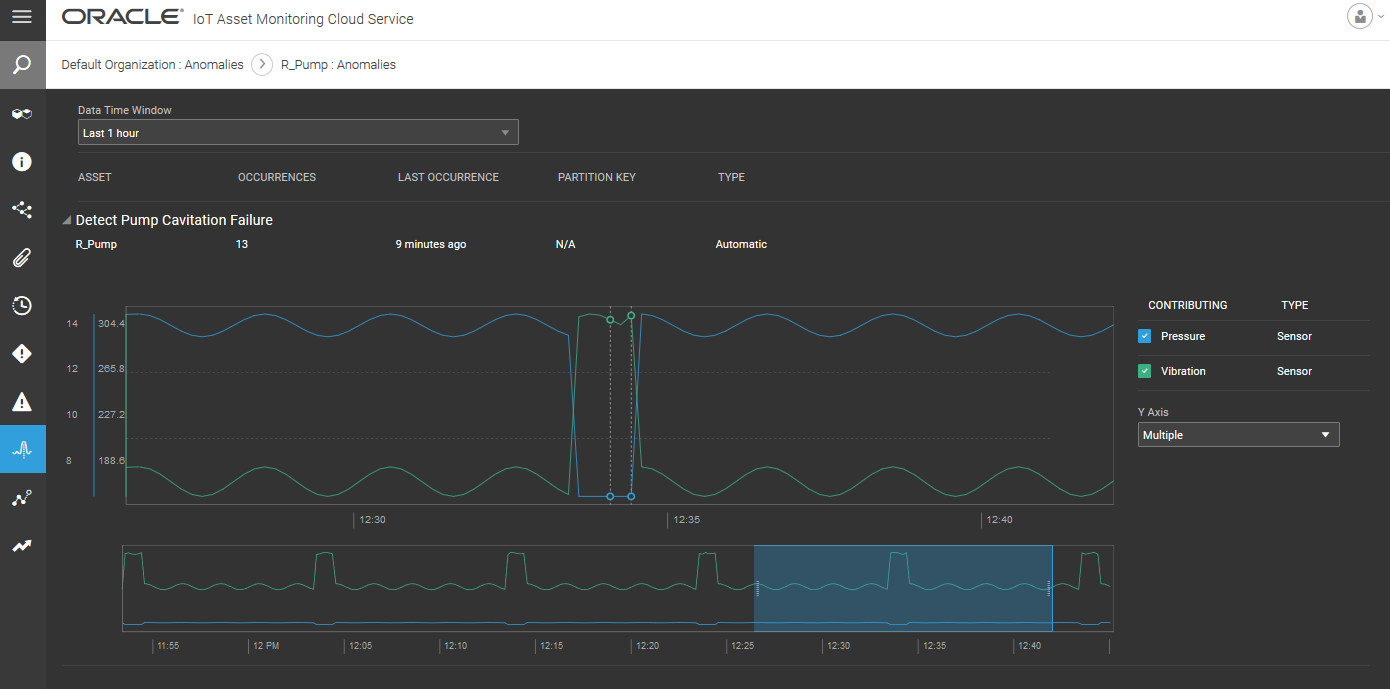
The following Operations Center view shows multivariate anomalies for a pump device. Notice that you can select the sensor signals that you wish to view in the chart. If the sensor values are disparate, you can choose multiple y-axes, so that you can see each signal using the correct scale.

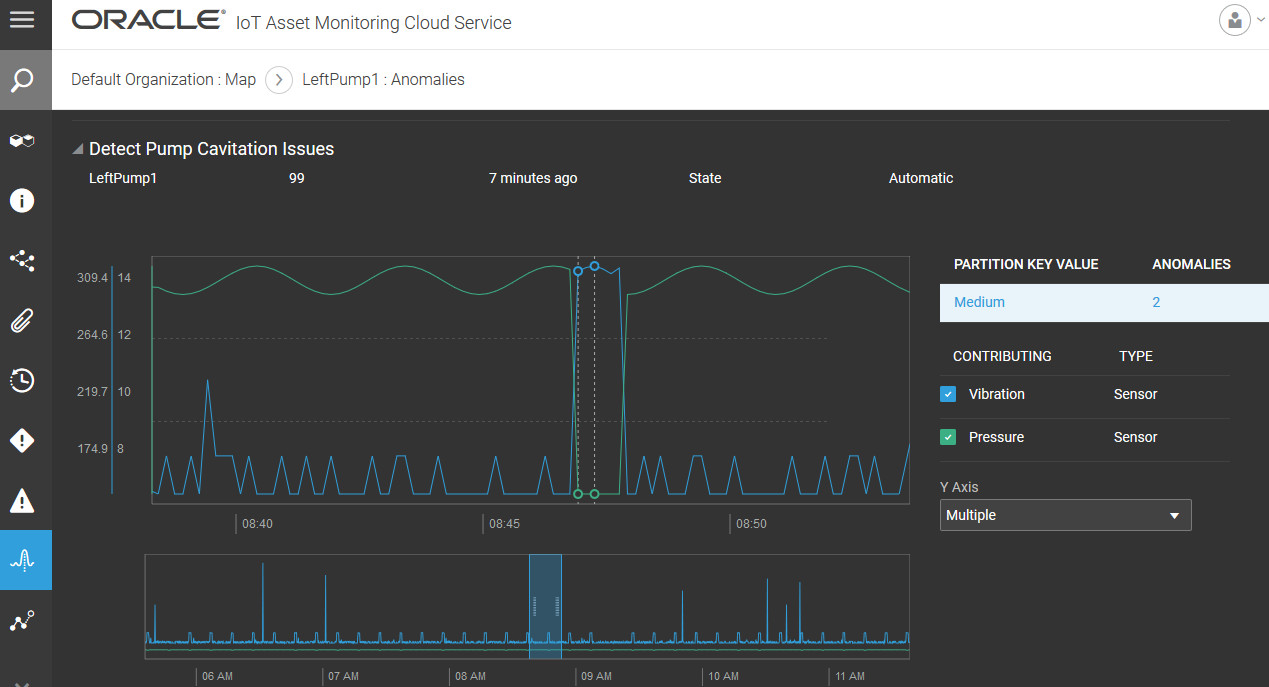
If you are using partition key values corresponding to asset states, then you can select the relevant partition key as well. The following view shows anomalies reported when the running state of the pump is Medium.

Note:
If you are using simulated sensor data to test your anomalies, refer to the following sections for more information on the data characteristics of simulated data: