Simulate Asset Sensors with the Built-In Simulator

Use simulations to test Oracle IoT Asset Monitoring Cloud Service or to demonstrate its features.

Create asset sensor simulations using the built-in digital twin simulator. Use the simulator to create data patterns for sensors associated with an asset. You can also simulate anomalous data patterns.

The simulator can also simulate device alerts and actions. You can choose to invoke these device actions from an asset page or rule.

Using the simulator, you can test and demonstrate features such as metrics, rules, incidents, and analytics.

Define a Simulation for a Sensor Attribute

Define wave pattern or formula-based sensor values for an asset sensor attribute.

Make sure you have created the asset type and added the sensor attribute that you wish to simulate.
  1. From the Create Asset Type or Edit Asset Type page, click the Attributes (Attributes Tab) tab to edit your sensor attribute.
  2. Under the Simulation column for your sensor attribute, click Edit Simulation (Edit icon).
  3. Choose the simulation Type.
    You can choose between predefined wave patterns, such as sine curves or square waves, and formula-based simulation values.
  4. Specify a Message Interval.
    The message interval is the frequency with which the simulated sensor sends messages.
  5. If you chose Pattern Based for the simulation Type, then select a wave pattern under Pattern.
    Depending on the wave pattern you select, you need to specify the required parameters for pattern generation.
    • For most wave patterns, you need to specify a maximum (Max) and minimum (Min) value.
    • For regular wave patterns, such as sine waves and square waves, you need to additionally specify the desired Wavelength of the patterns.
    • For a constant wave pattern, specify the constant Value.
  6. If you chose Formula for the simulation Type, then use the formula editor to enter a formula.
    The formula can use available functions, such as aggregation functions, trigonometric functions, mathematical, string, and time functions. You can also use other sensor attribute values as properties, use various operators such as logical and arithmetic operators, and use constants.
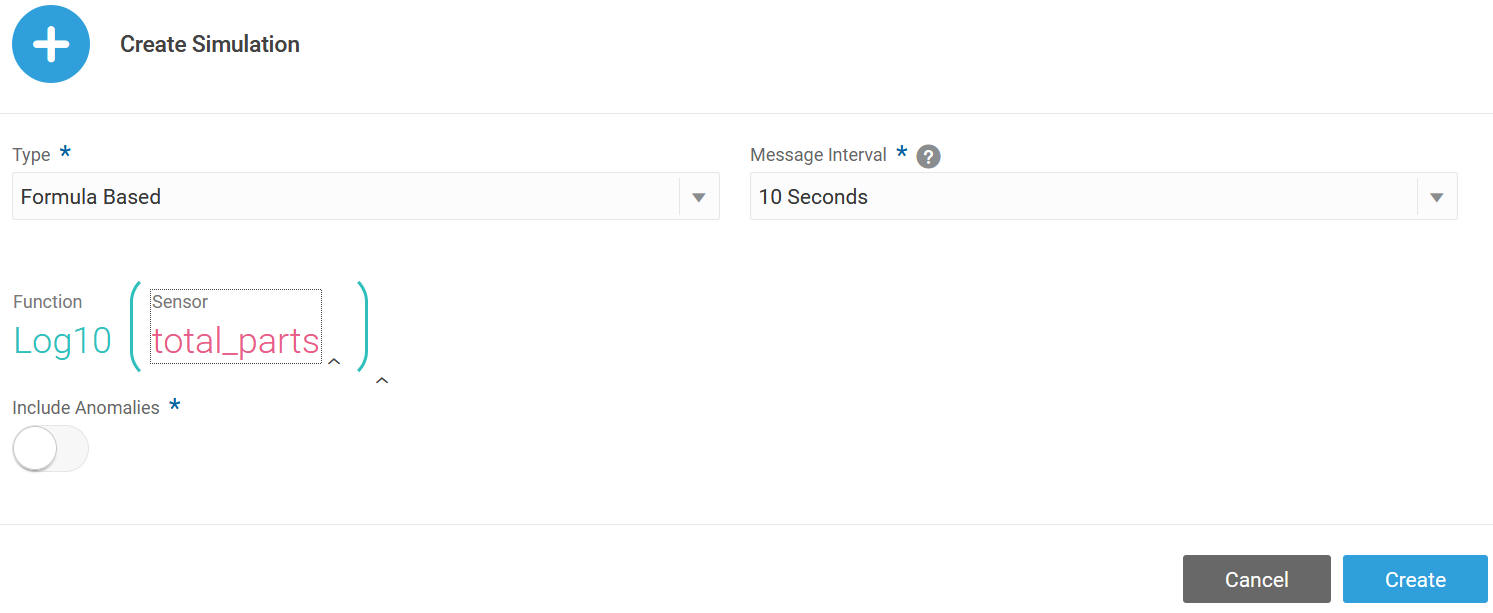
    The following example makes use of a logarithmic function to plot the number of parts produced. Note that the function can optionally make use of another sensor attribute in the formula.
    Formula editor uses the following formula: log (total_parts)

  7. If you wish to introduce periodic anomalies in the simulated data, select Include Anomalies.
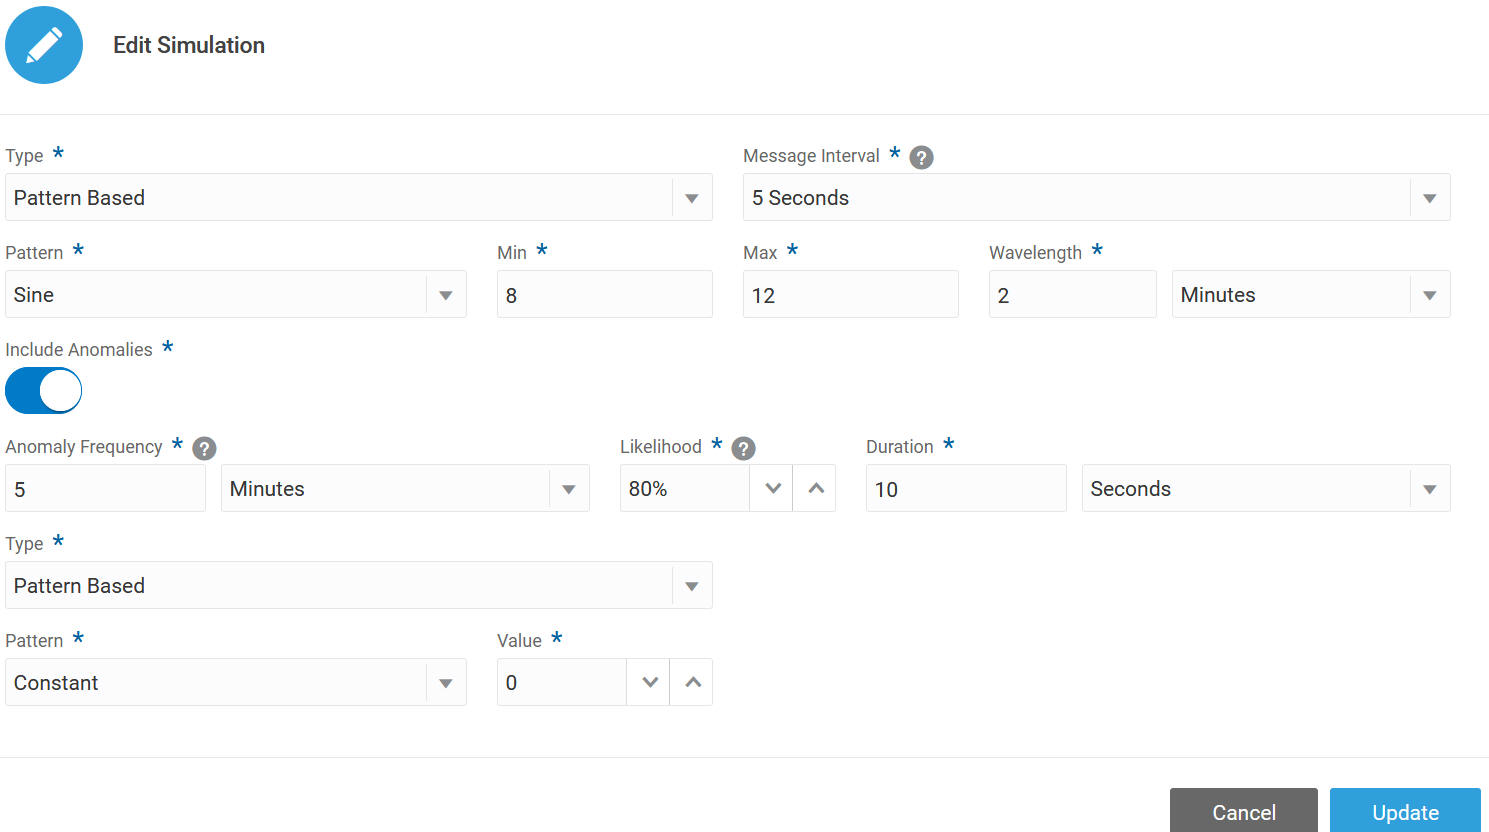
    • Anomaly Frequency: The periodic time period with which the anomaly occurs. For example, a value of 5 minutes will mean that the anomaly would be attempted every 5 minutes.
    • Likelihood: You can make the anomaly more random by specifying a likelihood percentage for the anomaly to occur. For example, a value of 80% means that there is an 80% chance of the anomaly occurring every time the periodic time period is reached. If you specify a value of 100%, then the anomaly occurs every time per the anomaly frequency.
    • Type: Choose the anomaly Type. You can choose between predefined wave patterns, such as sine curves or square waves, and formula-based simulation values, as described before.
    The following example shows a simulated electric current sensor attribute with simulated anomalies. We have simulated a sinusoidal simulation pattern for the electric current sensor. Every 5 minutes, there is an 80% likelihood of an anomaly occurring that results in the current dropping to 0 for 10 seconds.
    Described in text.

    The output sensor attribute simulation can be viewed from the asset page of an asset belonging to the same asset type.

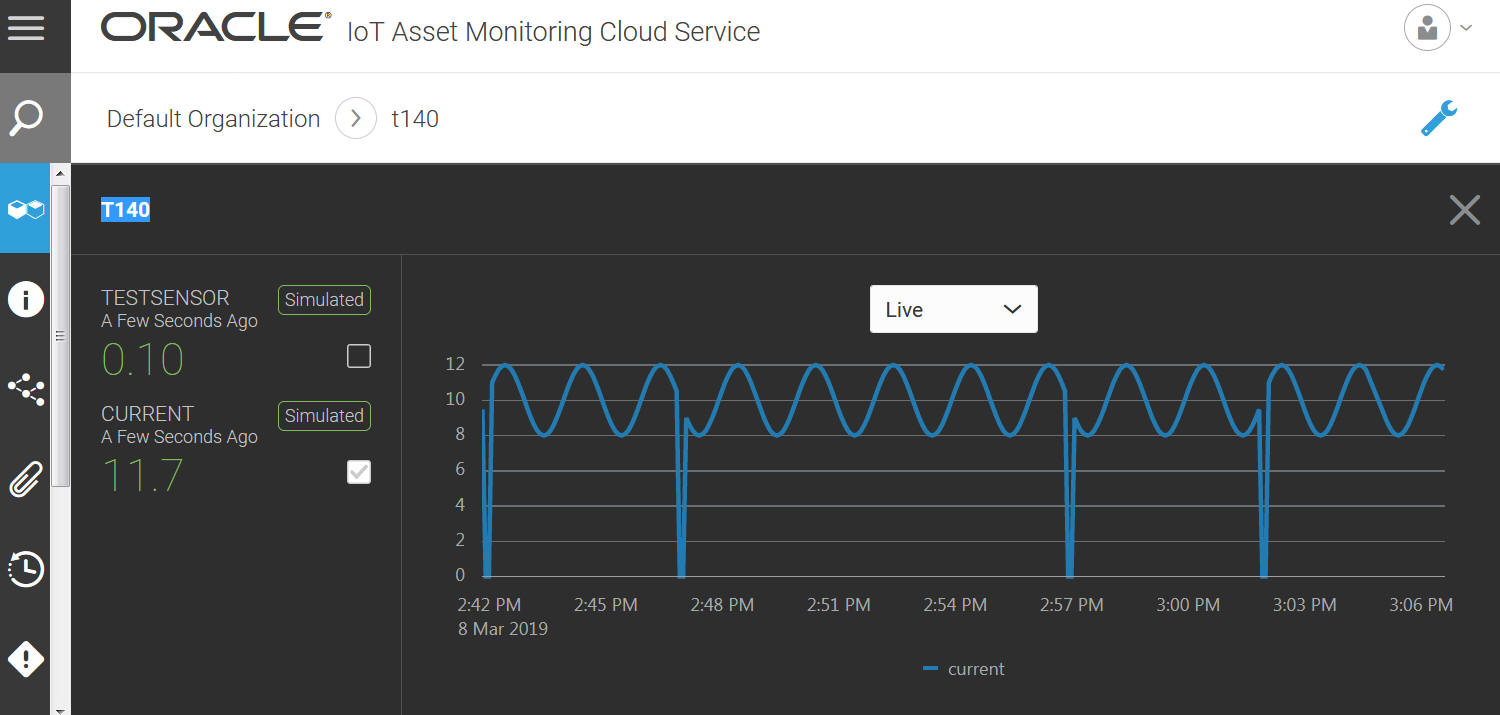
    The following image shows the resultant output simulation pattern for the electric current sensor attribute. Notice that the Sine waves oscillate between 8 and 12 amperes, as designed. Any two consecutive crests or troughs are 2 minutes apart, as determined by the wavelength. The anomalies occur at 2:42, 2:47, 2:57, and 3:02 pm. An anomaly does not occur at 2:52 pm, as the likelihood of the anomaly occurring is not 100%.
    Described in text.

Create Simulated Actions

Define simulated actions to simulate sensor patterns and values when an action is invoked.

  1. Click Menu (Menu icon), and then click Design Center.
  2. Select Asset Types from the Design Center sub-menu.
  3. Select an asset type from the Asset Types list.
    You can also search for an asset type.
  4. Click Actions.
  5. Click Create Action (Add icon).
  6. Specify a Name for the action.
  7. Under Simulations, click Add (Add icon) to add a simulation.
  8. Select the Sensor Attribute to simulate.
  9. Select the Duration for which the action simulation lasts.
  10. Choose the simulation Type.
    You can choose between predefined wave patterns, such as sine curves or square waves, and formula-based simulation values.
  11. If you chose Pattern Based for the simulation Type, then select a wave pattern under Pattern.
    Depending on the wave pattern you select, you need to specify the required parameters for pattern generation.
    • For most wave patterns, you need to specify a maximum (Max) and minimum (Min) value.
    • For regular wave patterns, such as sine waves and square waves, you need to additionally specify the desired Wavelength of the patterns.
    • For a constant wave pattern, specify the constant Value.
  12. If you chose Formula for the simulation Type, then use the formula editor to enter a formula.
    The formula can use available functions, such as aggregation functions, trigonometric functions, mathematical, string, and time functions. You can also use other sensor attribute values as properties, use various operators such as logical and arithmetic operators, and use constants.
  13. Click Add (Add icon) to add any additional simulations.
    Provide the simulation settings.
  14. Select Execute Items Sequentially if you want to process the action items sequentially. Alternatively, select Execute Items in Parallel if you want to process the action items in parallel.
  15. Click Save to save the action.

Simulate an Attribute, Action, or Alert for an Asset

To simulate alerts, sensor attribute patterns, and actions for an asset, make sure that the corresponding alerts, simulated sensor attributes, and simulated actions are defined for the asset type.

  • To simulate a sensor attribute for an asset, set the Data Source for the sensor attribute to Simulated in the Create New Asset or Edit Asset page.
  • To enable a predefined simulated action, set the Data Source for the sensor attribute to Simulated in the Create New Asset or Edit Asset page.
    Once enabled, you can trigger the action from the Asset (Digital Twin) page in Operations Center. Click Asset Controls to see the actions that you can trigger.
  • To enable simulated alerts for an asset, set the Data Source for the sensor attribute to Simulated in the Create New Asset or Edit Asset page.
    Once enabled, you can trigger the alert from the Asset (Digital Twin) page in Operations Center. Click Asset Controls to see the actions that you can trigger.

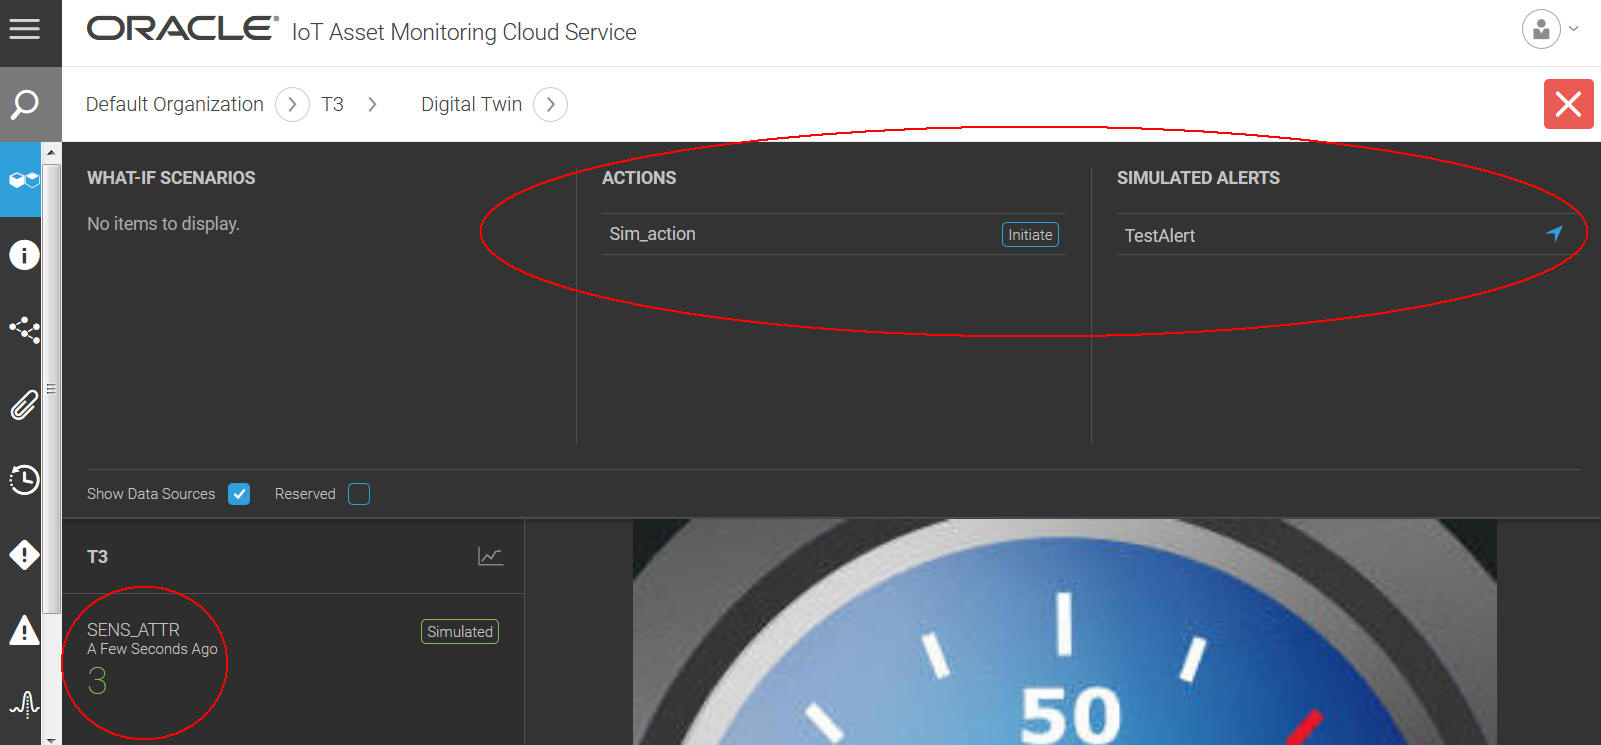
    The following image shows the Actions and Alerts sections on the Assets (Digital Twin) page.


    Actions and alerts sections on the Asset (Digital Twin) page

Tips and Considerations for Simulated Data and Analytics Artifacts

When generating and using simulated data to test your analytics artifacts, such as anomalies and predictions, keep in mind the data characteristics of your generated data.

When you define simulations for an asset type, any simulated assets that you create for the asset type will generate similar data patterns and values.

When creating random data based simulations, remember that random data patterns are akin to noise, and cannot be predicted. Avoid creating predictions on random data, as the prediction training will fail for random data. You may, however, create a meaningful metric on the sensor generating random data, and base your predictions on the metric.

If you are generating data with a high percentage of anomalies to test anomaly features, then avoid creating predictions on such data. In the real world, if a sensor is reporting large amounts of anomalous data, then the anomalies feature will detect these, and you should use the same to rectify or replace the sensor or asset. Prediction training may fail on data that contains a disproportionately large number of anomalies.