Create a User-Defined Anomaly

Create a user-defined anomaly to look for patterns in sensor data generated by an asset.
  1. Click Menu (Menu icon), and then click Design Center.
  2. Select Asset Types from the Design Center sub-menu.
  3. Select an asset type from the Asset Types list.
    You can also search for an asset type.
  4. Click Anomaly Detection.
  5. Click the Create Anomaly (Create Anomaly icon) icon.
    The Anomaly Detection Editor appears for the selected asset type.
    The anomaly detection that you define will apply to all assets of the chosen asset type.
  6. In the Details section, enter a name for the anomaly in the Name field.
  7. (Optional) Specify an optional Description text for the anomaly.
  8. (Optional) Select a value under Keep Metric Data For.
    If you have unique storage requirements for historical data related to this anomaly, you can select an option that is different from the global settings defined under Storage Management on the application Settings page.
    For example, if you are calculating anomalies across a large number of assets, and the anomaly data is not required beyond a month, then you can select 30 Days under Keep Metric Data For to optimize storage.
  9. Under Detection, select User Defined Anomaly as the Detection Method.

    A user-defined anomaly lets you manually specify anomalous or normal data patterns for a sensor or metric. You can select the data pattern from existing sensor, or metric, data. Alternatively, you can manually plot an anomalous data pattern that the system uses to identify anomalies.

  10. Select an available Target Attribute / Metric to monitor.

    The list of attributes includes sensor attributes and query-type (computed) metrics. For example, a temperature sensor asset may include the temperature attribute.

  11. (Optional) If you have defined one or more failure modes for your asset type, select Include Failure Mode Details to associate a failure mode with the anomaly.
    1. Select a pre-existing Failure Mode that corresponds to the anomaly.
    2. Select one or more pre-existing Failure Causes that apply to the anomaly.
    See Add Failure Diagnostics Information to Asset Incidents and Anomalies for more information on using failure modes.
  12. Under Training, select a Specimen Asset that provides the data pattern for anomaly detection.

    A list of all assets with the selected asset type appears. The asset with the most data is chosen by default. You can choose a different asset if required.

  13. Choose a Selection Type, and complete the corresponding steps.

    Note:

    Do not use random data when testing your anomalies. If using simulated test data, do not use random patterns. Note that range-binding simulated data is not enough to make it non-random. Threshold-based algorithms cannot work with random data.

    • Choose Anomalous Data to select an anomalous data pattern from existing sensor or metric data.

      Make sure that the pattern is clearly identified and selected. Anomaly detection will look for anomalous pattern resemblance, and not necessarily similar values. If anomalous data patterns are not correctly identified, your selected pattern may have too few data points.

      1. (Optional) Change the Data End Time for the chart, if required. The current date and time are automatically populated.

      2. (Optional) If you wish to show contextual annotations using event data stored in a contextual data connection, then select Show Contextual Annotation.

        For example, if you have breakdown events and their timestamps stored in a Database Classic Cloud Service table, you can overlay this data on your sensor data timeline to define pattern anomalies that occur before the breakdown events. See Use Contextual Annotations in Pattern Anomalies for more information.

      3. Click Generate Chart to display the sensor or metric data for the selected attribute and asset.

        The data plot for the selected asset attribute appears.

      4. Use the mouse to select the anomaly pattern in the data plot.


        Anomaly selection

        You can zoom in and zoom out in the data plot area. You can also navigate along the time axis using the Next and Previous buttons.

        If you wish to change the selected pattern, you can select another pattern in the data plot and the first pattern is deselected.

      5. Click Save to save the anomaly.

    • Choose Acceptable Data to select normal behavior data or non-anomalous data from existing sensor or metric data.

      1. Select a Deviation Percentage.

        An appropriate threshold-based algorithm is chosen to detect user-defined anomalies. The dDeviation Percentage. is the threshold deviation percentage. Note that you may need to tweak your deviation percentage value in case you are getting false positives, or in case not enough anomalies are being reported.

      2. Specify a Data Start Time and Data End Time to plot the chart.

        This is the broad time period that contains acceptable, or non-anomalous, attribute data.

      3. Click Generate Chart to display the sensor or metric data for the selected attribute and time period.

        The data plot for the selected asset attribute appears.

      4. Click within the left-half chart to select the start time.

        This marks the beginning of acceptable, or non-anomalous, data.

      5. Click within the right-half chart to select the end time.

        This marks the end of the sample (acceptable) data.


        Selecting acceptable data.

      6. Click Save to save the anomaly.

    • Choose User Defined Data to manually plot an anomalous data pattern.

      1. Enter the Event Frequency.

        The event frequency specifies the time interval (in milliseconds) between any two data points.

      2. Specify the Number of Points that you need to plot.

      3. In the Scale field, enter a lower and upper limit for the sensor attribute.

      4. Click Generate Chart.

        An empty chart is created based on the scale, frequency, and number of data points that you specified.

      5. Create an anomaly pattern by clicking at various points in the data plot area.

      6. Click Save to save the anomaly.

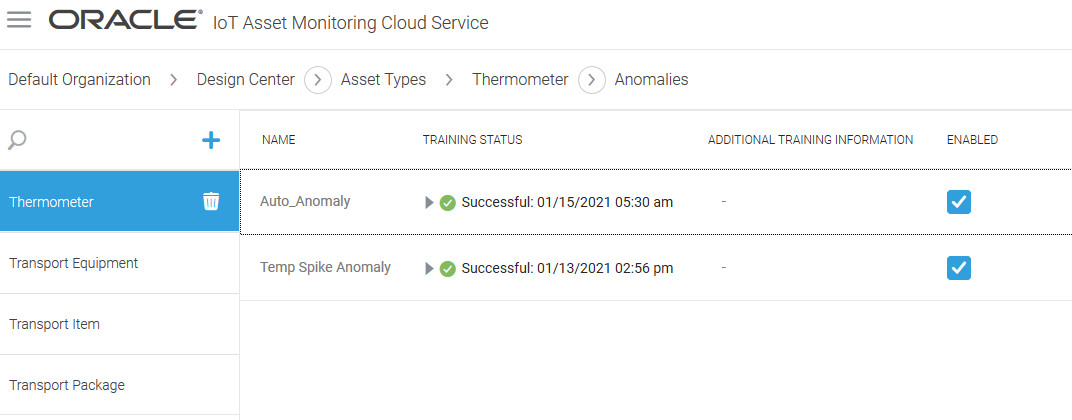
The anomaly is added to the Anomalies page. The Training Status column shows the latest training status for the anomaly model. Once training is complete, the application starts detecting and reporting anomalies.
Anomalies showing completed training timestamps

The application reports completed model trainings along with their timestamps. If training fails, the application includes pertinent information related to the failure. For example, the chosen training data set's statistical properties might not be suitable. The Feedback Center is also used to notify the Asset Manager about failures.

You can enable or disable an anomaly from within the Anomaly Editor. If an anomaly has been disabled by the system, a relevant message appears inside the Editor. The message also appears on the Anomalies page in Operations Center.
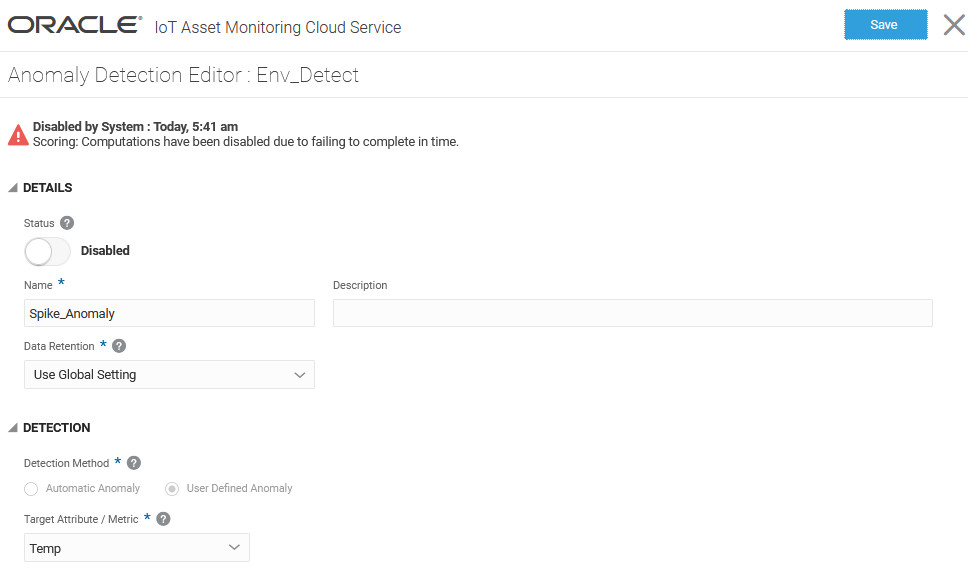

Anomaly Editor: System Disabled

Use Contextual Annotations in Pattern Anomalies

When manually creating pattern-based anomalies, you can add contextual annotations to the data plot if you have contextual data stored in a data connection. This can help identify events, such as breakdowns, on the sensor data plot.

For instance, if you have breakdown events and their timestamps stored in a Database Classic Cloud Service table, you can overlay this data on your sensor data timeline to define pattern anomalies that occur before the breakdown events.
  1. Create a manual anomaly as described in Create a User-Defined Anomaly.
  2. Select Show Contextual Annotation to add contextual annotations.
  3. Select a Data Source.

    The data source contextual link is the name of your Database Classic Cloud Service or Autonomous Transaction Processing contextual data connection.

  4. Specify the contextual data table column that corresponds to Important Event Field.
    This column should contain information about events related to your asset.
  5. Specify the contextual data table column that corresponds to the Timestamp Field for the events.
    This column should contain timestamp information for the stored events.
  6. Click Generate Chart to display the sensor or metric data along with the contextual annotations.