Track Individual and Cumulative Asset Metrics Using Dashboards
Use dashboards to track individual and cumulative metrics or key performance indicators (KPIs) for your assets. You can create dashboards at the asset level, group level, or the organization level.
Oracle IoT Asset Monitoring Cloud Service dashboards let you track key metrics for your monitored assets, such as assets connected, assets available, and assets utilization.
The following are some examples of system metrics (KPIs) that are available to be added to a dashboard:
-
Assets Connected: Shows the percentage of assets that are currently connected. An asset counts as connected if the application has heard from the asset sensors in the last one hour.
For an individual asset dashboard, this means
-
Asset Connectivity: Used for asset-level dashboards, the metric shows whether the asset is currently connected. An asset counts as connected if the application has heard from the associated sensor in the last one hour.
You can select a time period to search for the percentage connectivity. For example, you can search for the percentage connectivity in the last 24 hours.
-
Asset Utilization: When used for group-level or organization-level dashboards, shows the percentage of assets that are currently utilized. An asset counts as utilized if the asset is not present in its assigned storage place.
-
Asset Utilization: When used for asset-level dashboards, the metric shows whether the asset is currently utilized. An asset counts as utilized if the asset is not present in its assigned storage place.
You can select a time period to search for the percentage utilization. For example, you can search for the percentage utilization in the last 24 hours.
-
Asset Availability: When used for group-level or organization-level dashboards, shows the percentage of assets that are currently available. An asset counts as available if there are no open outage incidents reported for the asset.
-
Asset Availability: When used for asset-level dashboards, the metric shows whether the asset is currently available. An asset counts as available if there are no open outage incidents reported for the asset.
You can select a time period to search for the percentage availability. For example, you can search for the percentage availability in the last 24 hours.
The system metrics are based on live data. A live metric value is refreshed every two minutes.
Some other examples of system metrics are Open Maintenances, Open Incidents, Open Routines, Open Outages, Open Warnings, and Located Assets.
If you have created user-defined metrics for your environment, you can add these to a dashboard to display the metric values aggregated over all your assets. See Define Your Own Metrics for more information on creating user-defined metrics to track asset data relevant to your business processes.
Adding a metric to a dashboard aggregates the metric over all assets of the asset type. For example, you may choose to display the average fuel level across your forklift assets.
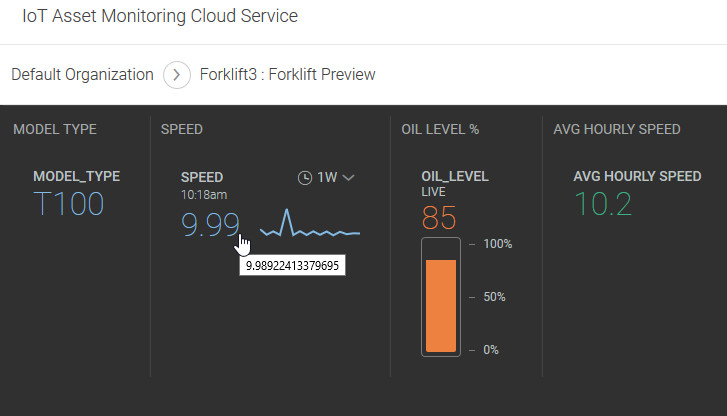
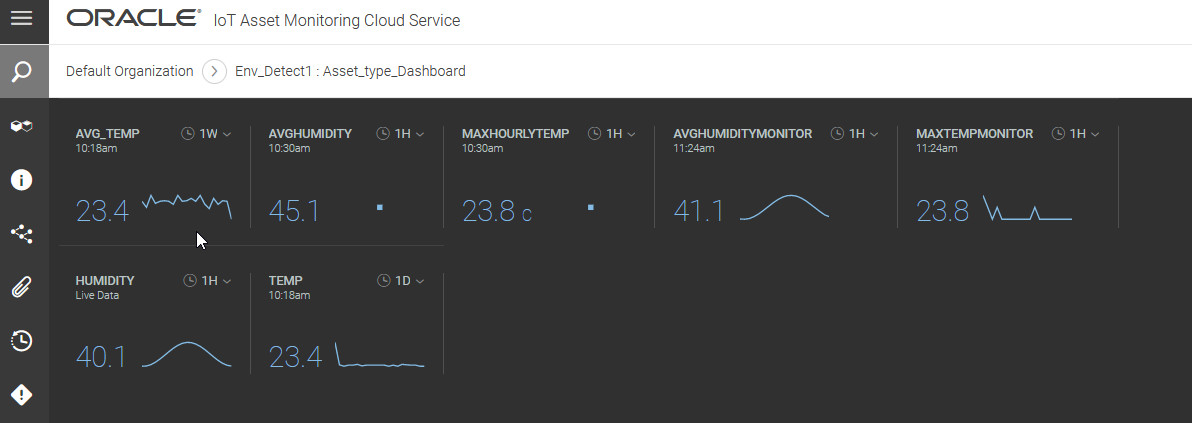
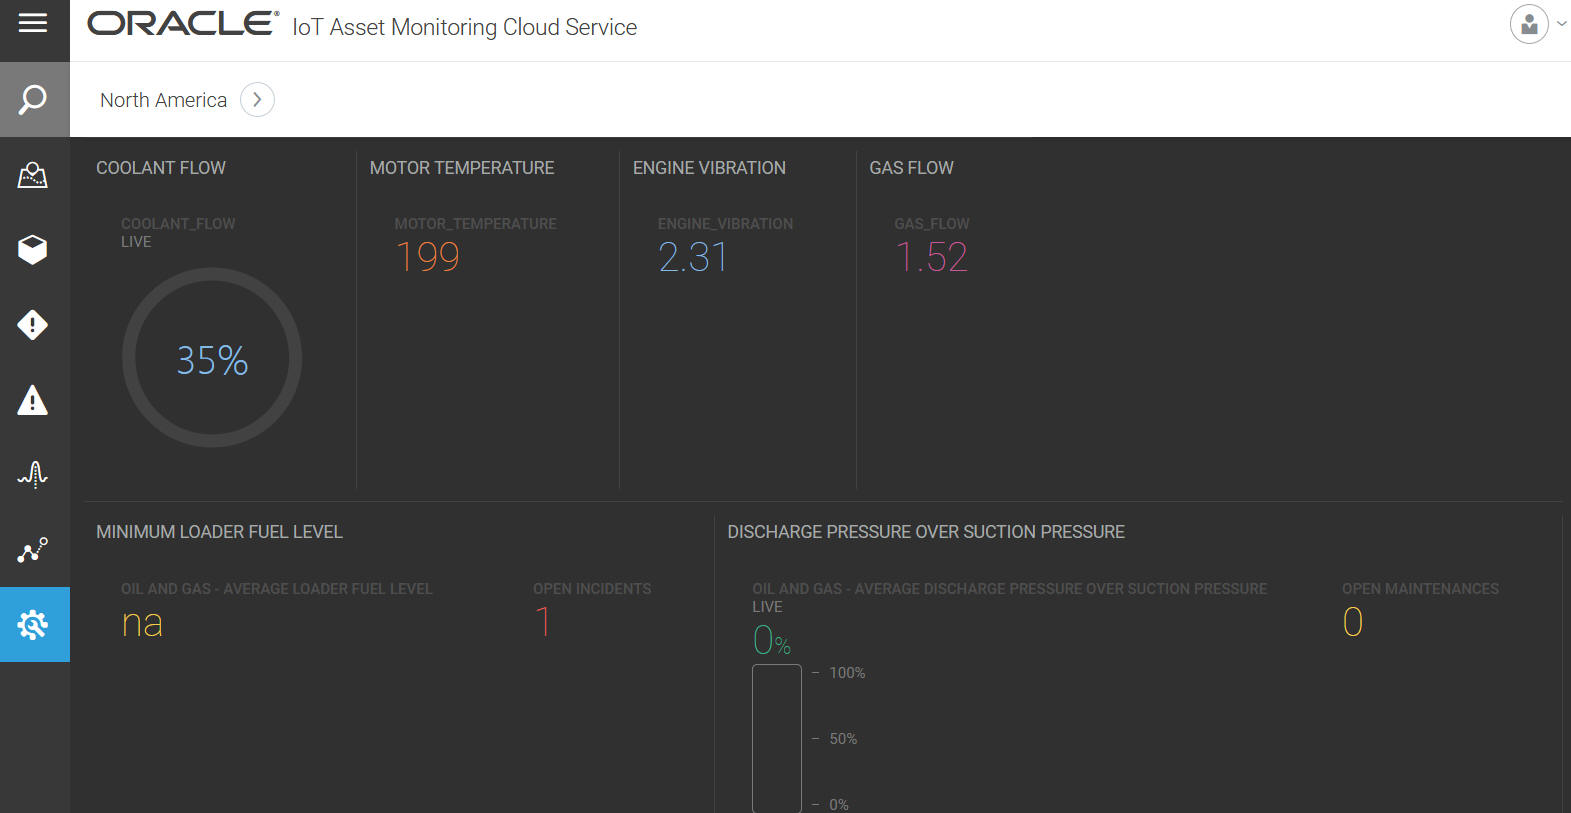
The following image displays a custom dashboard in the Operations Center view:
Create a Dashboard at the Organization Level
When you create a dashboard at the organization level, you can add metrics from across your organizational assets to the dashboard. The dashboard appears in your Operations Center menu bar.
Create a Dashboard at the Group Level
Create a dashboard at the group level to add metrics relevant to your group assets. The dashboard appears in your Operations Center menu bar when you change the context to the group using the breadcrumbs.
Create a Dashboard at the Asset Level
When you create a dashboard at the asset level, you can add metrics relevant to the asset type to the dashboard. The dashboard appears in your Asset Details page menu bar.
Access the Dashboard Metrics
Switch to a previously-created dashboard for an asset, group, or organization to track the cumulative metrics or key performance indicators (KPIs) for your assets.
- To access a dashboard previously created for the organization, click your dashboard icon on the menu bar in the Operations Center organization view. You can change your view context using the navigation breadcrumbs in the Operation Center.
- To access a dashboard previously created for the group, click your dashboard icon on the menu bar in the Operations Center group view. You can change your view context using the navigation breadcrumbs in the Operation Center.
- To access a dashboard previously created for an asset type, click your dashboard icon on the menu bar in the Asset Details page.
Access Location, Historical Sensor Data, and Sensor Charts for a Sensor Gadget
If your dashboard gadget is a sensor attribute, you can click the gadget on the dashboard to quickly access the location of the corresponding asset in a pop-up window. You can also view historical, tabular sensor data and charts in the pop-up window.
Add a Metric to a Dashboard
Add a metric or Key Performance Indicator (KPI) to your dashboard to display aggregated metric data across applicable assets.
Visualize and Compare Past Metric Data
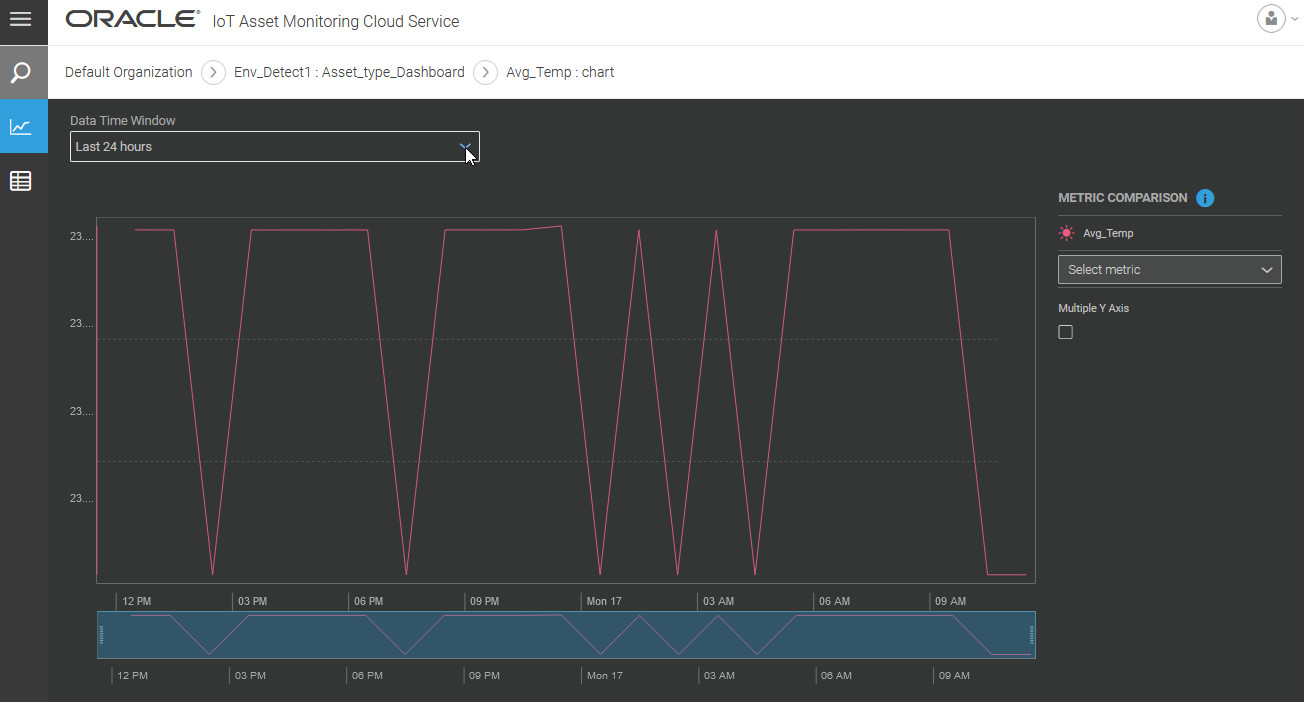
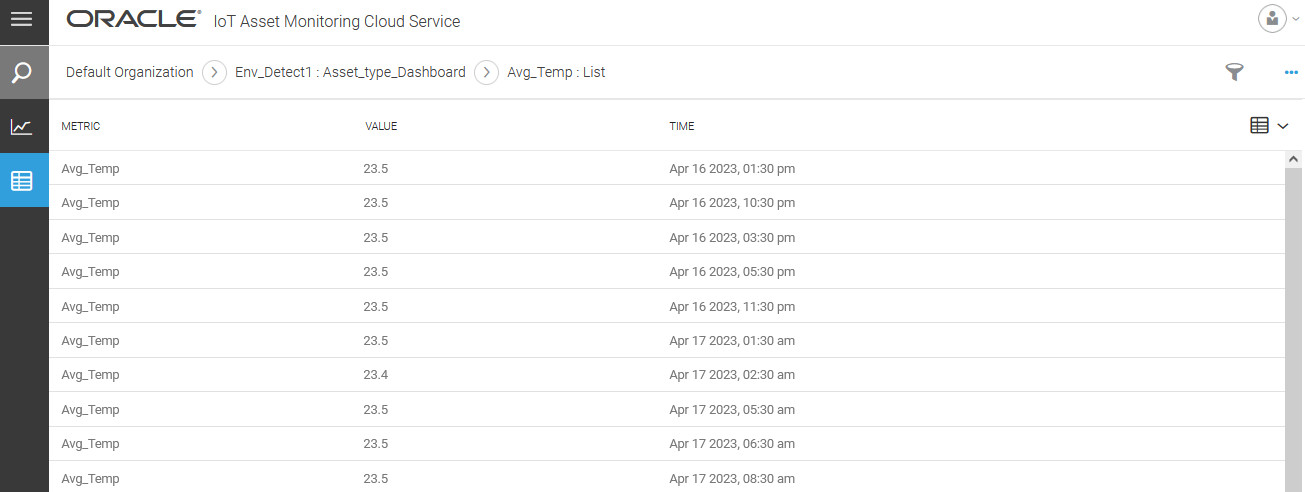
You can view past metric data, in addition to the current metric value, for your dashboard metric gadgets. Choose between the chart view and the tabular view to look at data up to 180 days in the past, depending on your metric storage policies. Past metric data is available for both built-in and custom metrics.
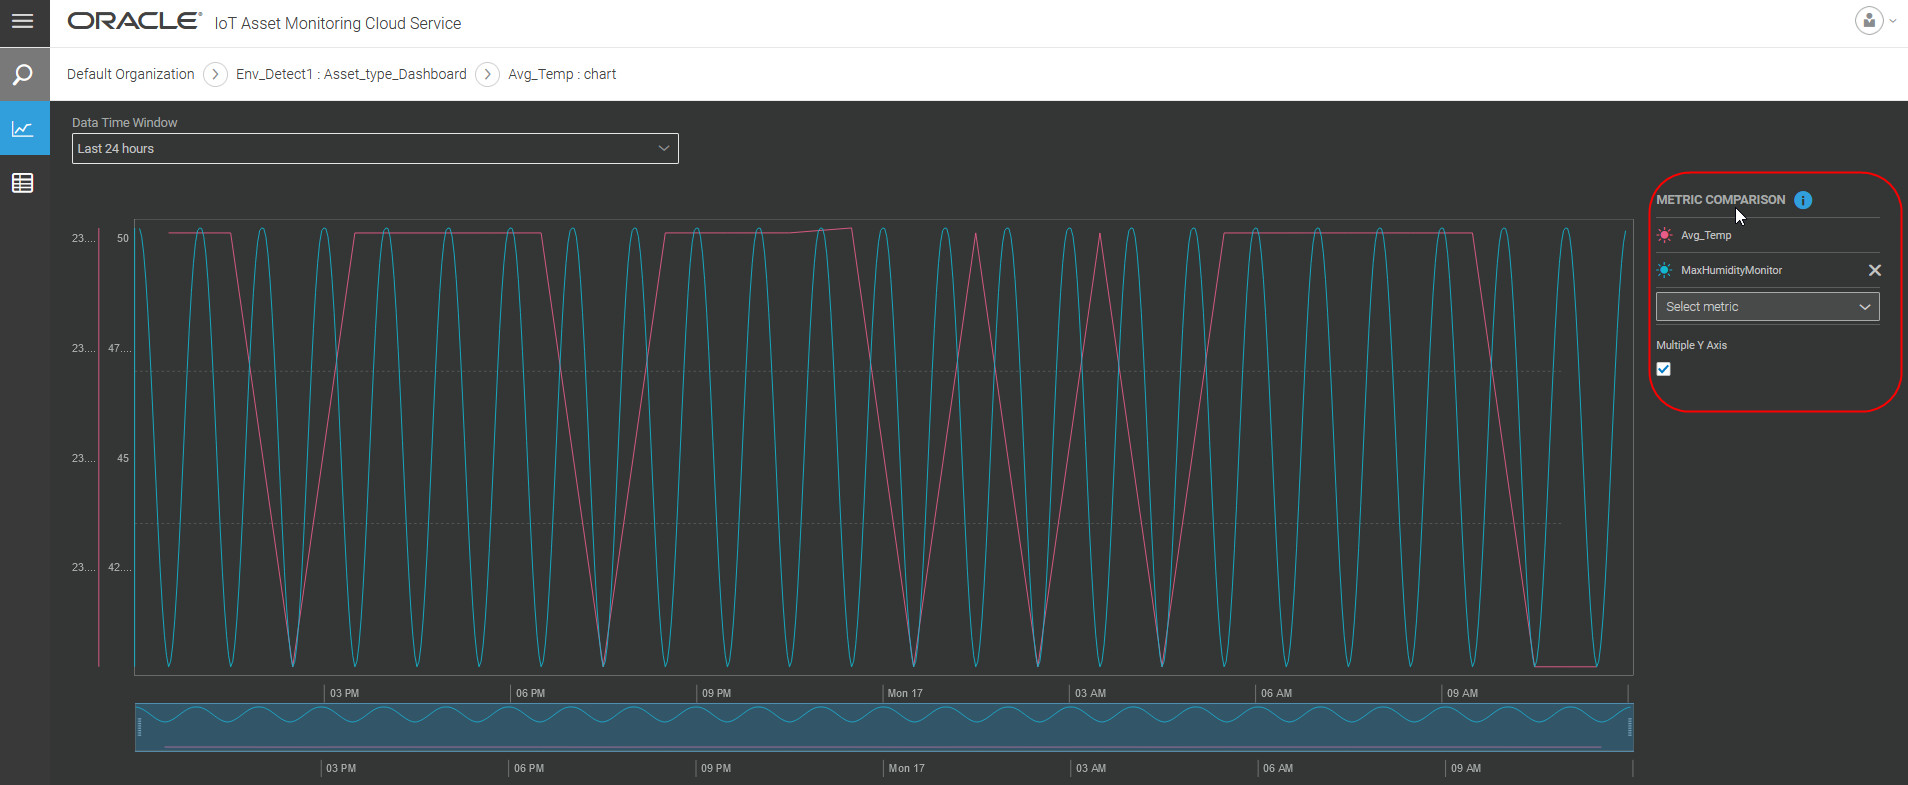
You can also compare up to four metrics in the chart view. For example, you may wish to study possible correlation between two metrics, say AveragePressure and AverageTemperature. If the metric values are disparate, you can choose multiple y-axes, so that you are able to see each metric plot using the correct scale.
Edit a Metric on the Dashboard
Edit a metric on the dashboard to change its aggregation settings, label, or appearance.
Change the Location of a Metric on a Dashboard
Change the location of a metric, so that the metrics appear in the order you require.
- Access your organization dashboard, group dashboard, or asset dashboard from the Organization page, Groups page, or Asset Details page respectively.
- Click Edit (
 ) against your dashboard row.
 - Click and drag a metric, or metric group, using the Handle (
 ), to a new location on the dashboard.
 - Click Save to save your dashboard changes.
Remove a Metric from the Dashboard
Remove a metric from the dashboard when it is no longer required.
- Access your organization dashboard, group dashboard, or asset dashboard from the Organization page, Groups page, or Asset Details page respectively.
- Click Edit (
 ) against your dashboard row.
 - Click the Delete (
 ) icon for the metric or metric group that you want to remove from your dashboard.
 - Click Save to save your dashboard changes.
Create a Dashboard Using External Content
If you have external reports, visualizations, and pages, such as those created in Oracle Analytics Cloud, you can embed these into custom IoT dashboards. When creating a new custom dashboard, select the External Content option to use an external URL that can be embedded into the dashboard.
