The Operation Center

The Operation center is the default view for your organization. When you first log in to Oracle IoT Fleet Monitoring Cloud Service, you are placed in the Operation center for your organization.

You can return to the Operation center from any page by clicking Menu and selecting Operation Center.

Monitor your fleet, vehicles, drivers, trips, shipments, and facilities from the Operation center. The Organization Dashboard is the default Operation Center page. The Organization Dashboard provides a snapshot view of the current status including threshold deviations or exceptions raised for trips, vehicles, drivers, facilities, equipment, ship-units or packages, and ship-items currently in-transit, for the active organization.
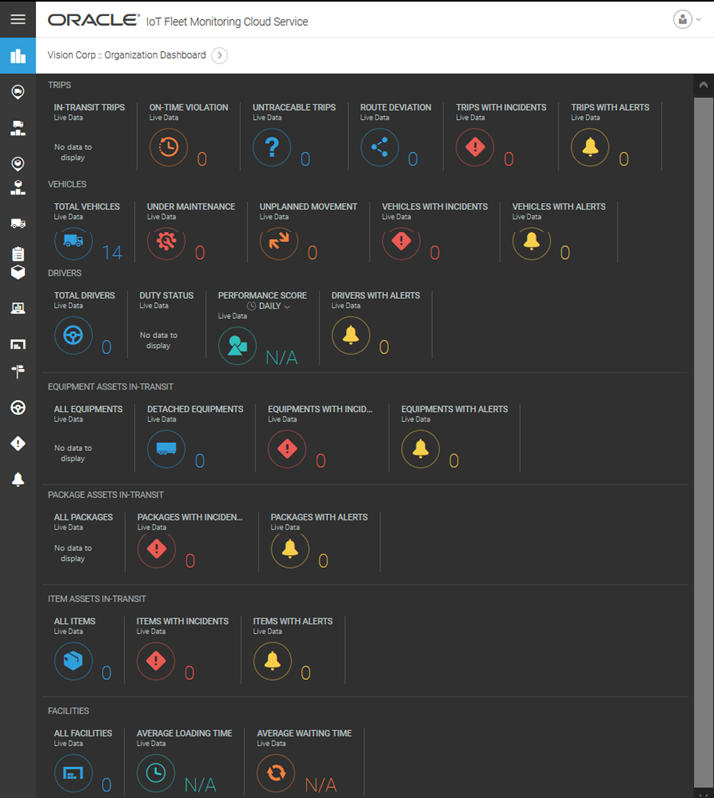

Operation Center page

The toolbar on the left lets you access the following pages:

Note:

The Shipment business object will be deprecated in a future release. Hence it is recommended to use Trips for real-time monitoring of in-transit movements.
Item Description

Organization Dashboard icon Organization Dashboard

This page provides you a snapshot view of the live status of the trips, vehicles, drivers, facilities, equipment assets, package assets, and item assets that are in- transit in the currently active organization. This page is the default view of the Operation Center. You can monitor live data of in-transit trips, untraceable trips, vehicles under maintenance, off-duty or on-duty drivers, equipment assets , package assets, and unit assets in-transit. These and several other vital parameters help you determine the overall performance of your organization in a single view. Note that the equipment assets, package assets and item assets are the well-known assets created and managed in Oracle IoT Asset Monitoring Cloud but have been leveraged in trips that are tracked and monitored in Oracle IoT Fleet Monitoring Cloud.

Fleet Map icon Fleet Map

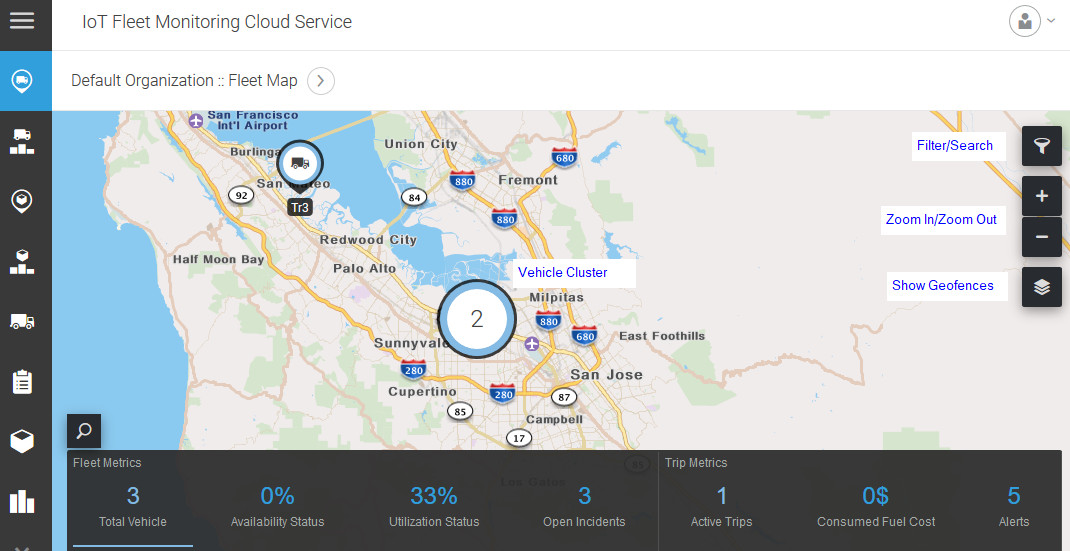
This page displays your fleet vehicles on the map. The Fleet Metrics and Trip Metrics display vehicle and trip metrics for the vehicles appearing on the map.

Shipments Map icon Shipments Map

Shows shipments on the map. Use the shipments map view and info view to get real-time insights into your shipments in transit. Shipment metrics are displayed in a ribbon at the bottom of the shipment map view. Use the metrics ribbon to quickly locate shipments and view shipment metrics including active shipments, incidents, untraceable shipments, delayed shipments, and transportation costs. Shipper or Administrator permissions are required to view the shipment map view.

Vehicles icon Vehicles

Lists your vehicles along with their details, such as registration number and status. Click Information View iconagainst a vehicle to view the vehicle dashboard.

Transaction Logs icon Transaction Logs

Transaction logs can assist with troubleshooting Oracle Transportation Management Cloud Service communication issues. The transaction logs display all trip or shipment data that was sent to (outbound) or received from (inbound) Oracle Transportation Management Cloud Service or Oracle Intelligent Track and Trace. See View Transaction Logs.

Shipments icon Shipments

Lists the shipments along with their details, such as driver, vehicle, stops, and delivery status details. Shipper or Administrator permissions are required to view shipment details.

Shipments: Dashboard icon Shipments: Dashboard

View the shipments dashboard to quickly determine shipment performance for the current day or the previous seven days. The key performance indicators (KPIs) displayed on the dashboard include details, such as average delay, average freight weight, total freight cost, and delivery status.

Facilities icon Facilities

Lists your facilities along with their average loading and waiting times.

Trips icon Trips

Shows your trips with details, such as status and trip alerts.

Drivers icon Drivers

Lists the designated drivers along with their duty statuses and currently assigned vehicles.

Incidents icon Incidents

Lists the incidents generated by rules. Details such as incident status, summary, priority, and creation time are also included.

Click Information View iconagainst an incident to view or update the incident.

Alerts icon Alerts

Lists the alerts generated by rules. Details such as description, alert type, rule type, and creation time are also included.

Click Information View iconagainst a rule type to view or edit the alert rule.

The breadcrumbs at the top let you filter your context. For example, use the breadcrumbs to navigate to a particular vehicle, trip, or driver in the organization.
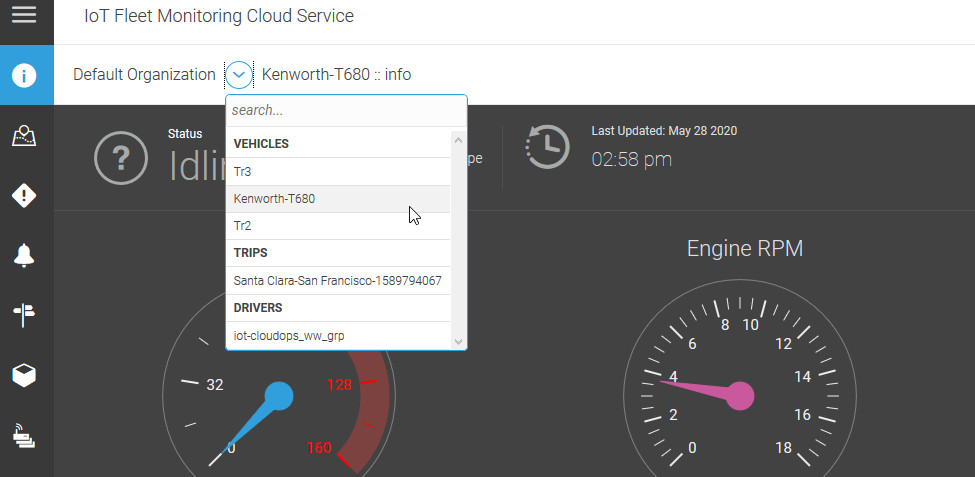

Breadcrumbs used to access a vehicle.

Use the Organization Dashboard

Use the Organization Dashboard to obtain the current status of all the entities of the active organization in a single view. Various widgets display the exceptions raised and deviations occurred for the entities and their sub-entities. It is also referred as an exceptions monitoring dashboard.
The out-of-box Organization Dashboard is the first view displayed when you sign in to the application. The status of all the entities in the current organization are displayed through widgets and icons where each panel of the dashboard represents an entity. Complete the steps to monitor, navigate, and examine the real-time status of each entity of the current organization. After signing in, you are on the Operation Center of the application and the Organization Dashboard is displayed.
  1. View the panels and their widgets. Notice that each panel is associated with an entity of the organization including Trips, Vehicles, Drivers, Facilities, Equipment Assets, Package Assets, Item Assets. Note that the equipment assets, package assets and item assets are the well-known assets created and manged in Oracle IoT Asset Monitoring Cloud but have been leveraged in trips that are tracked and monitored in Oracle IoT Fleet Monitoring Cloud.
  2. Notice that the first widget of each panel displays the total count of the entity in the organization. The remaining widgets display the count of entities with aberration, exceptions, or deviations, such as incidents, alerts, detached, untraceable, under maintenance and so on. Review the panel and widget content from his table:
    Panel - Entity Name Widgets – Status Indicators
    Trips In-Transit Trips, On-Time Violation, Route Deviation, Untraceable Trips, Trips with Incidents, Trips with Alerts
    Vehicles Total Vehicles, Unplanned Movement, Under Maintenance, Vehicle with Incidents, Vehicles with Alert
    Drivers Total Drivers, Duty Status, Performance Score (Daily/Weekly), Drivers with Alerts
    Facilities All Facilities, Average Loading Time, Average Waiting Time
    Equipment Assets In-Transit All Equipment, Detached Equipment, Equipment with Incidents, Equipment with Alerts.
    Package Assets In-Transit All Packages, Packages with Incidents, Packages with Alerts
    Item Asset In-Transit All Items, Items with Incidents, Items with Alerts.
  3. Explore and review the widgets of the Vehicles panel to monitor the real-time status of in-transit vehicles in the current organization.
    1. To examine the live data on the map, click a widget of the panel
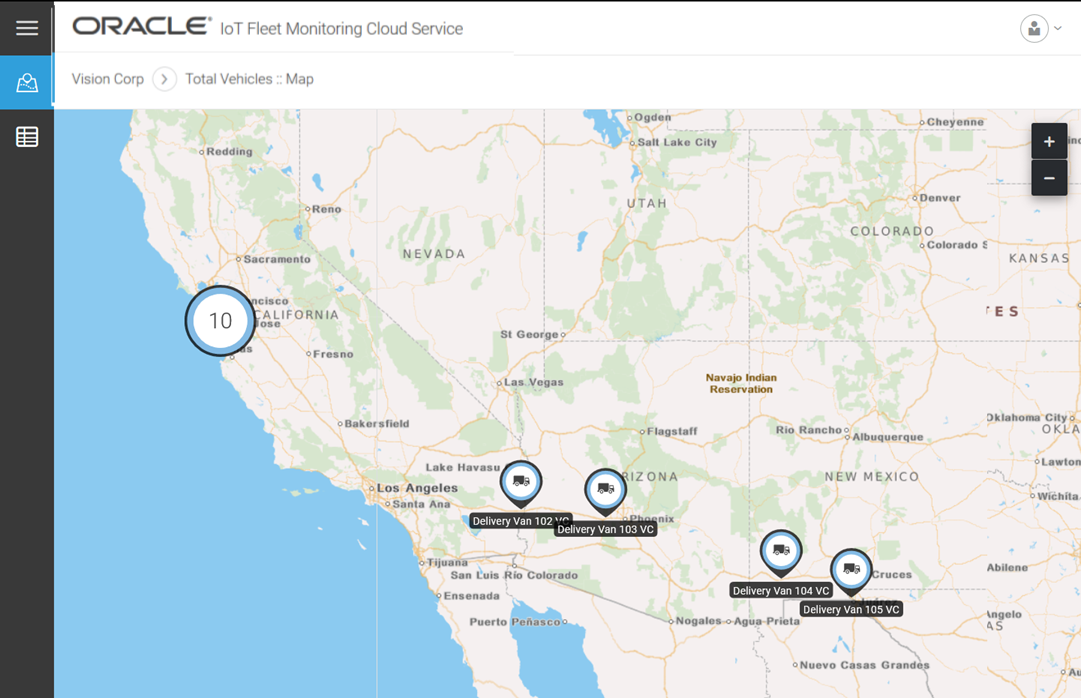
      The map view appears and the entity's count for the status indicator is displayed on the map based on their geo-location.
    2. To view each entity instance individually on the map, click the count values until each entity instance appears on the map You can zoom-in by double clicking an entity on the map.
      Map View
    3. To view a summary list of the entities, on the left navigation bar, click List View List View icon.
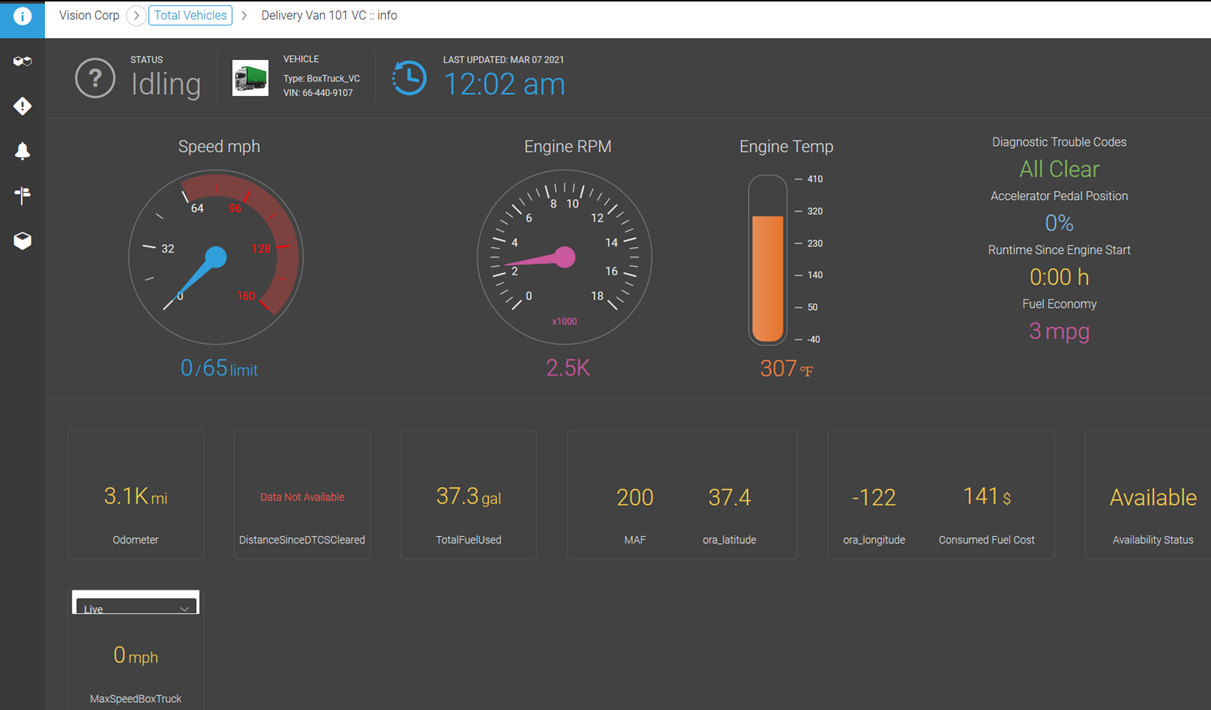
    4. To examine a vehicle in detail, scroll towards the end of the record, hover over it, and click Information Information icon.
      The information view of the vehicle is displayed.Vehicle Information View
    5. Use the breadcrumb navigation links to go back to the list view or the organization dashboard.
  4. Repeat Step 3 for the remaining panels on the dashboard to obtain the status of all other entities including trips, drivers, facilities, equipment, packages, and items, of the organization.

Locate Your Vehicles in the Fleet Map

Use the map view to quickly locate the physical locations of your fleet vehicles. Your vehicles can appear independently, or clustered together, depending on your zoom level in the map.


Map View with Filter icon, Geo-Fences icon, zoom control, and vehicle cluster

  1. In the Operation Center, click Fleet Map in the menu bar.

    Note:

    If you are already on a vehicle, driver, or trip page, you can return to the map view by clicking the organization name in the breadcrumb navigation.
  2. Use the zoom buttons (+ and -) to zoom in or out in the map view.
  3. Click a vehicle cluster to separate out the individual vehicles. Alternatively, zoom in further to separate the clustered vehicles.
  4. Click an individual vehicle to view the vehicle details.
  5. (Optional) Click the Filter icon to search for individual vehicles based on vehicle attributes such as vehicle name, status, type, location, and driver name.
  6. Click the GeoFences icon to show existing geofences on the map.