View Transaction Logs

Use the Transaction Logs dashboard to view and understand the status of all transactions exchanged between external systems (Oracle Transportation Management Cloud Service (OTM) or Oracle Intelligent Track and Trace (ITT)) and Oracle IoT Fleet Monitoring Cloud. Transaction logs can assist with troubleshooting communication issues with OTM or ITT when shipment data is sent from or received by Oracle IoT Fleet Monitoring Cloud.

The Transaction Logs dashboard displays all shipment data details that were sent to (outbound) or received from (inbound) OTM or ITT, including whether a transaction is a success or failure, along with the reason for failure and corresponding corrective actions to be taken, if any.

The following are examples of scenarios for which transaction logs are generated:
  • If you haven't done driver mapping between OTM and Oracle IoT Fleet Monitoring Cloud and you are using a driver while importing OTM shipment, then the import fails and a corresponding transaction log is generated. You can view this log and take the corresponding corrective action.

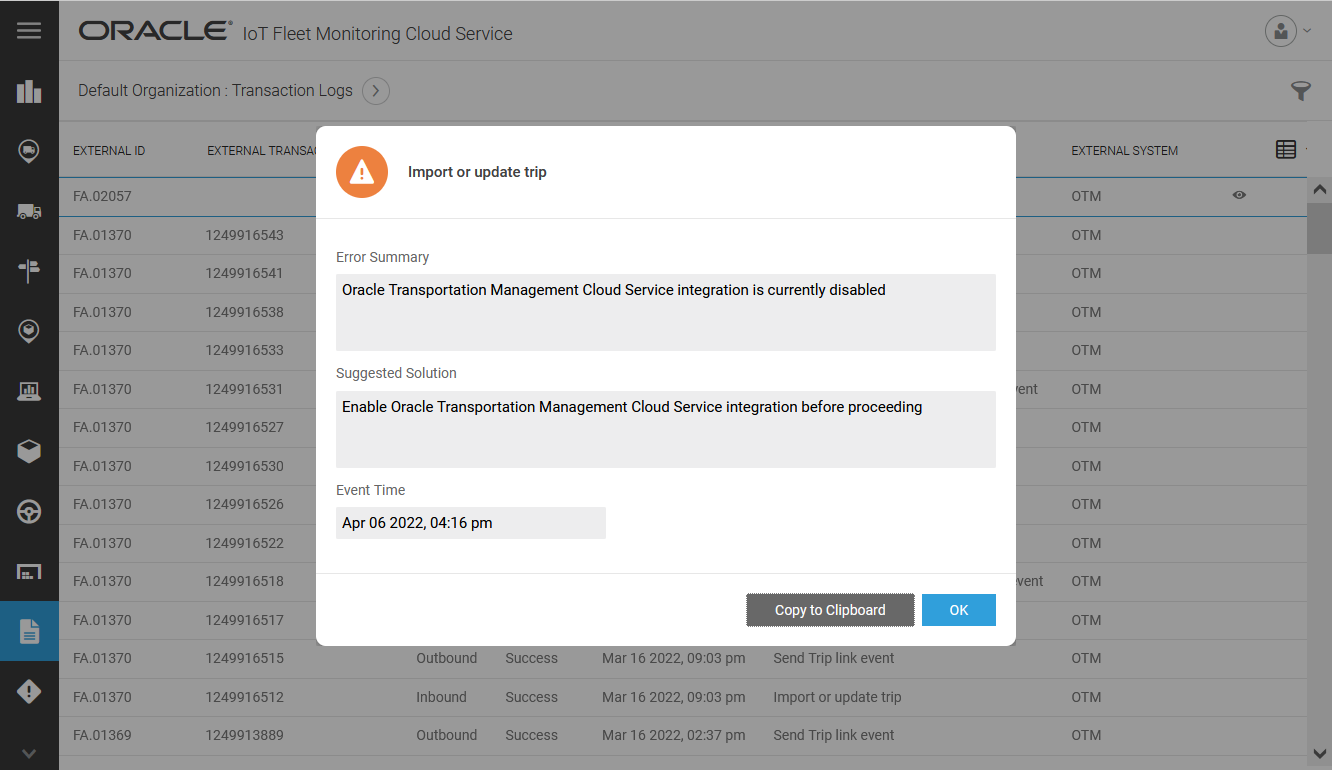
  • If OTM integration is not enabled in Oracle IoT Fleet Monitoring Cloud and you try to import an OTM shipment, then the import fails and a corresponding transaction log is generated and displayed in the Transaction Log dashboard.

To view the transaction logs dashboard, you should be in the Operation Center area of the current organization.
  1. From the Operation Center menu options, click Transaction Logs (Transaction Logs icon)

    In the right pane, the transaction logs dashboard is displayed.


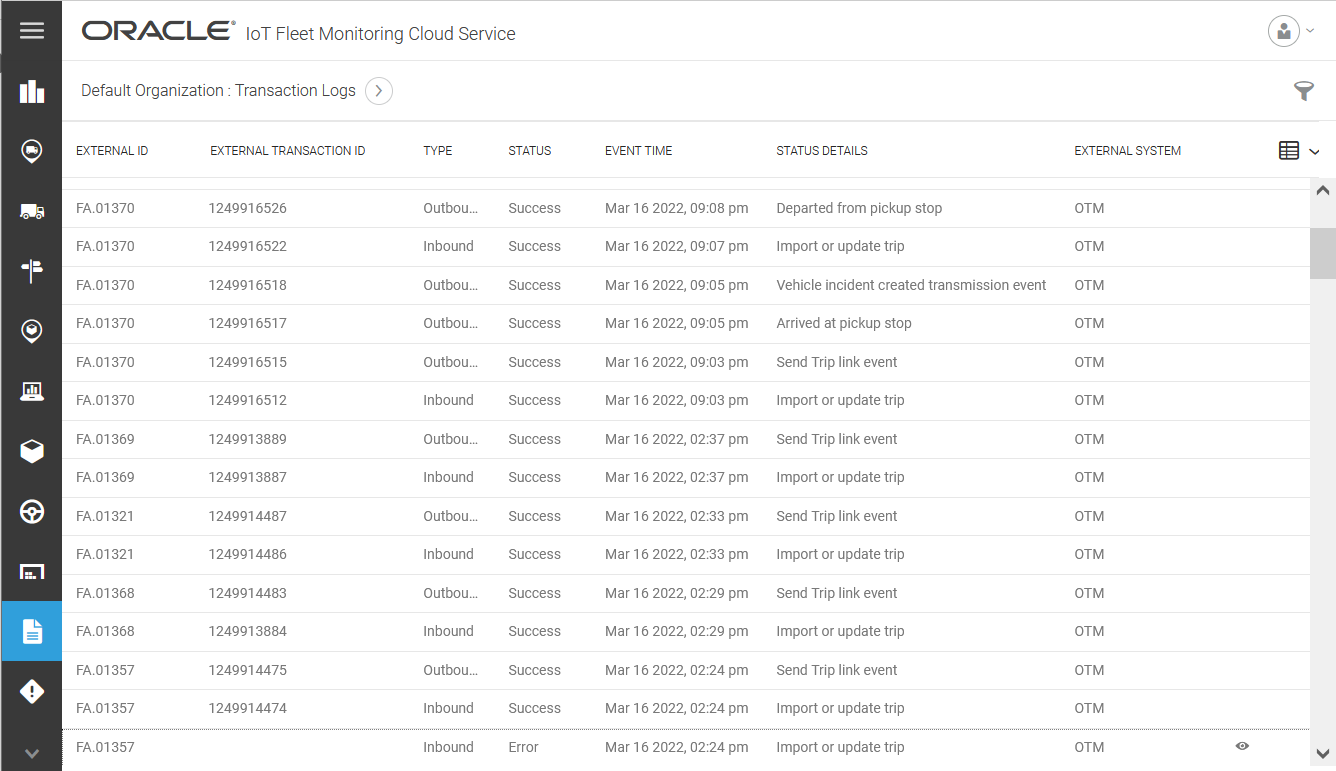
    Transaction Logs Dashboard

    The transaction logs dashboard contains the following columns:

    • External ID: Shipment ID as received from OTM or ITT.

    • External Transaction ID: Transaction ID of a transaction as recorded by OTM or ITT.

    • Type: The type of transaction, whether Inbound or Outbound. Shipment data details sent from Oracle IoT Fleet Monitoring Cloud to OTM or ITT are Outbound type of transactions. Shipment data details received by Oracle IoT Fleet Monitoring Cloud from OTM are Inbound type of transactions.

    • Status: The status of a transaction. Its value can be Success or Error.

    • Event Time: The transaction timestamp in the timezone of the Oracle IoT Fleet Monitoring Cloud server.

    • Status Details: A short message summarizing the transaction status.

    • External System: Specifies whether the transaction log is for events exchanged with OTM or ITT.

  2. (Optional) Click Information Information icon to view details for transactions that display Error in the Status column. In the dialog box that is displayed, click Copy to Clipboard to copy the error information to the clipboard, or click OK to return to the Transaction Logs dashboard.

    Transaction log error dialog box

  3. (Optional) Click the (Filter icon) icon and specify a search criterion to view only those transaction logs that match the search criteria.

You can configure the number of days for which transaction logs are retained. The default value is 90 days. You can change the default value in the Data Storage page that can be accessed from Menu > Settings > Storage Management tile.