13 Monitor Shipments and Facilities

Use the shipments map view and info view to get real-time insights into your shipments in transit. Shipment monitoring can help you lower supply chain costs and reduce customer attrition by identifying risks, problems, and delays early. An user with the shipper role can view shipment information. Use the facilities map view to obtain real-time information about the loads checked in, checked out, docked, and expected.

Note:

The Shipment business object will be deprecated in a future release. Hence it is recommended to use Trips for real-time monitoring of in-transit movements.

After configuring an integration with Oracle Transportation Management Cloud Service, shipment data gets imported to Oracle IoT Fleet Monitoring Cloud Service, which you can view, track, and monitor from the Design Center. Use the KPI ribbon at the bottom of the shipments map view to view shipment metrics including active shipments, incidents, untraceable shipments, delayed shipments, and transportation costs. The shipments KPI dashboard lets you monitor shipment metrics and the shipments dashboard provides you cumulative analytics data of shipments. The shipments info view and map view helps you to keep customers aware of any potential delays and you always know where their packages are and when they will be delivered.

After configuring an integration with Oracle Warehouse Management Cloud Service and importing facilities into Oracle IoT Fleet Monitoring Cloud Service, you can view and monitor facilities, its KPIs, and metrics from the Design Center.

View All Shipment Metrics

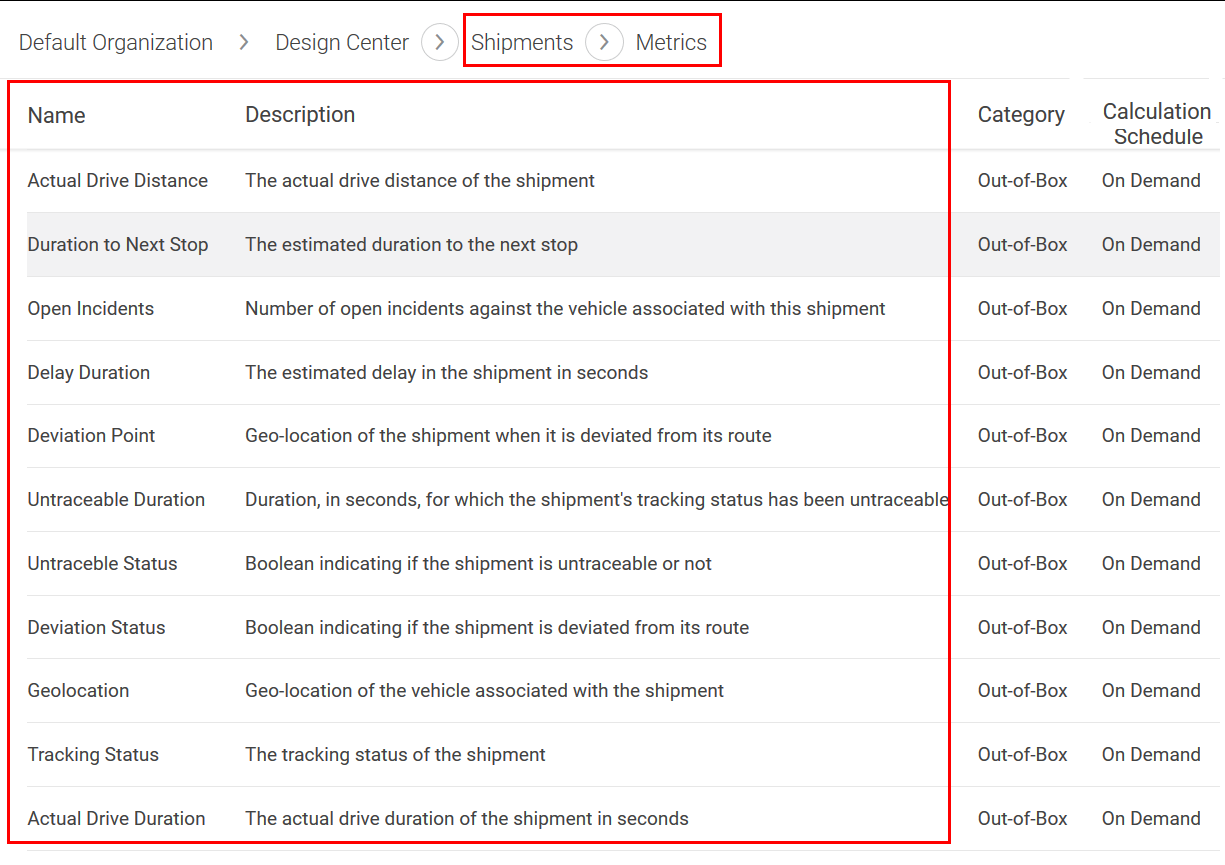
You can view all the in-built and user-defined metrics for shipments of an organization from Design Center. The Edit (Edit icon), Duplicate (Duplicate icon), and Delete (Delete icon) icons are active for user-defined KPIs only.

The in-built metrics and the custom metrics are categorized as out-of-box and user-defined respectively.
  1. Click the Menu (Menu icon) icon, and then click Design Center.
  2. Click Shipments and then click Metrics (Metrics icon)
  3. From the metrics list, review the Description field of each metric to understand their purpose and usability.
    The shipment metrics are displayed in a table with four fields including Name, Description, Category, and Calculation Schedule. Shipment metrics page of the default organization viewed from the design center.
  4. Use the drop downs in the breadcrumbs area to move to a specific design center option or shipments page.
  5. (Optional) Click the Menu (Menu icon) icon to view the Design Center options.

Use the Shipments Metrics Ribbon

Shipment metrics are appears in a ribbon at the bottom of the shipments map view. Use the metrics ribbon to quickly locate shipments of the current organization and view shipment metrics including active shipments, incidents, untraceable shipments, delayed shipments, and transportation costs. Shipper (IoTFMShipper) permissions are required to view the shipment map view.

You should be at the Operation Center of the current organization.
  1. From the Operation Center menu options, click Shipments Map ( Shipments Map icon).
  2. Select one of these options on the Shipment Metrics ribbon:
    • Total: Select this option to display the number of active shipments of the current organization in the selected view. The numeric value indicates the number of shipments in the current view. When map magnification is low, shipments in the same geographic location are grouped in clusters with the number of shipments displayed within an icon.
    • Incidents: Select this option to display the number of reported shipment incidents of the current organization in the selected view.
    • Untraceable: Select this option to display the number of shipments of the current organization that have not received a location update for an hour or longer.
    • Delayed: Select this option to display the number of delayed shipments of the current organization in the selected view.
    • Transportation Cost: Select this option to display the transportation costs for all shipments of the current organization in the selected view.

Add a KPI to the Shipment Metrics Ribbon

Add a new shipment key performance indicator (KPI) to the shipment metrics ribbon at the bottom of the shipments map view of the current organization to monitor shipment KPI data that is important to your business. Shipper (IoTFMShipper) permissions are required to view the shipments map view.

You can modify the KPI bar or the metrics ribbon of the shipments map view of the current organization from the Design Center of the organization.
  1. Click Menu (Menu icon), click Design Center and then, click Organization.
  2. On the Organization page, click SHIPMENT KPI BAR (KPI Bar icon) to edit it.
  3. On the Edit KPI Bar page, to add a metric on the existing Shipment Metrics group, click Add New Gadget (Add icon).
  4. On Create Dashboard Item, select Metrics or Sensor Attributes in the Type list.
  5. Select a metric or a sensor attribute n the Metric list.
    Based on your selection of the metric, its unit of measurement is displayed on Unit .
  6. Select an aggregation value in the Aggregation list.
    This field is only active for KPIs displaying an aggregate value. An aggregate value is created by an aggregate function that groups multiple values together to form a single value.
  7. (Optional) Select a color for the KPI in the Color list.
  8. Enter a display name in the Label text box.
  9. Click Create.
    Your KPI appears on the Edit KPI Bar page.
  10. On the Edit KPI Bar page, click Save.
    You'll receive a Save Successful message.
  11. (Optional) Click Back to return to the organization page.

Create a Custom Metrics Ribbon in the Shipment Map View

Metrics ribbons in the map view display key performance indicator (KPI) shipment data. Create a custom metrics ribbon to display KPI shipment data that is specific to your business needs.

You can add a metrics group to the metrics ribbon of the shipments map view of the current organization from the Design Center of the organization.
  1. Click Menu (Menu icon), click Design Center and then, click Organization.
  2. On the Organization page, click SHIPMENT KPI BAR (KPI Bar icon) to edit it.
  3. On the Edit KPI Bar page, to add a new group beside the Shipment Metrics group, click Add Metric Group (Add New Group icon) that appears beside the Add New Gadget icon .
  4. Enter a name for the metrics ribbon.
    A new group is created where you can add new KPIs or sensor attributes by using its Add New Gadget icon.
  5. Click Save.
  6. On the Edit KPI Bar page, click Save.
    You'll receive a Save Successful message.
  7. (Optional) Click Back to return to the organization page.
In the Operation Center, Shipment Map view, the metrics ribbon or the KPI bar displays the new metric group beside the Shipment Metrics group.

Rearrange KPI Data in the Shipment Map View

Rearrange the order and location of sensor and KPI data on the metrics ribbon at the bottom of the map view to meet your specific requirements.

  1. Click Menu (Menu icon), click Design Center and then, click Organization.
  2. On the Organization page, click SHIPMENT KPI BAR (KPI Bar icon) to edit it.
  3. On the Edit KPI Bar page, select one of these options:
    1. Click and hold Drag (Drag icon) in the top right of a KPI and then drag the KPI to a new location on the same group.
    2. Click and hold Drag (Drag icon) in the top right of a KPI and then drag the KPI to a new location on a different group.
    3. Click and hold Drag (Drag icon) in the top right of a group and then drag the entire group to a new location.
  4. On the Edit KPI Bar page, click Save.
    You'll receive a Save Successful message.
  5. (Optional) Click Back to return to the organization page.

Edit an Existing KPI in the Shipment Map View

Edit KPI data currently displayed in the metrics ribbons at the bottom of the shipment map view to change or edit the information that is displayed. For example, you can change the display color of the KPI data.

  1. Click Menu (Menu icon), click Design Center and then, click Organization.
  2. On the Organization page, click SHIPMENT KPI BAR (KPI Bar icon) to edit it.
  3. On the Edit KPI Bar page, select a KPI and click Edit (Edit icon) iand then edit the settings for the KPI.
  4. Click Update.
  5. Click Save.
    You'll receive a Save Successful message.
  6. (Optional) Click Back to return to the organization page..

Remove a KPI from a Shipment Map View Ribbon

Remove a KPI from a metrics ribbon at the bottom of the shipment map view when it is no longer required.

  1. Click Menu (Menu icon), click Design Center and then, click Organization.
  2. On the Organization page, click SHIPMENT KPI BAR (KPI Bar icon) to edit it.
  3. On the Edit KPI Bar page, choose the KPI and click Delete (Delete icon)
  4. On the Edit KPI Bar page, click Save.
    You'll receive a Save Successful message.
  5. (Optional) Click Back to return to the organization page.

Remove a KPI Group from the Metrics Ribbon

Remove a metrics group from the shipment map view's metrics ribbon when it is no longer required.

  1. Click Menu (Menu icon), click Design Center and then, click Organization.
  2. On the Organization page, click SHIPMENT KPI BAR (KPI Bar icon) to edit it.
  3. On the Edit KPI Bar page, click Delete (Delete icon) for the metrics group you want to remove from the map view.
  4. On the Confirm Delete dialog box, click Delete.
  5. On the Edit KPI Bar page, click Save.
    You'll receive a Save Successful message.
  6. (Optional) Click Back to return to the organization page.

View the Shipments Dashboard

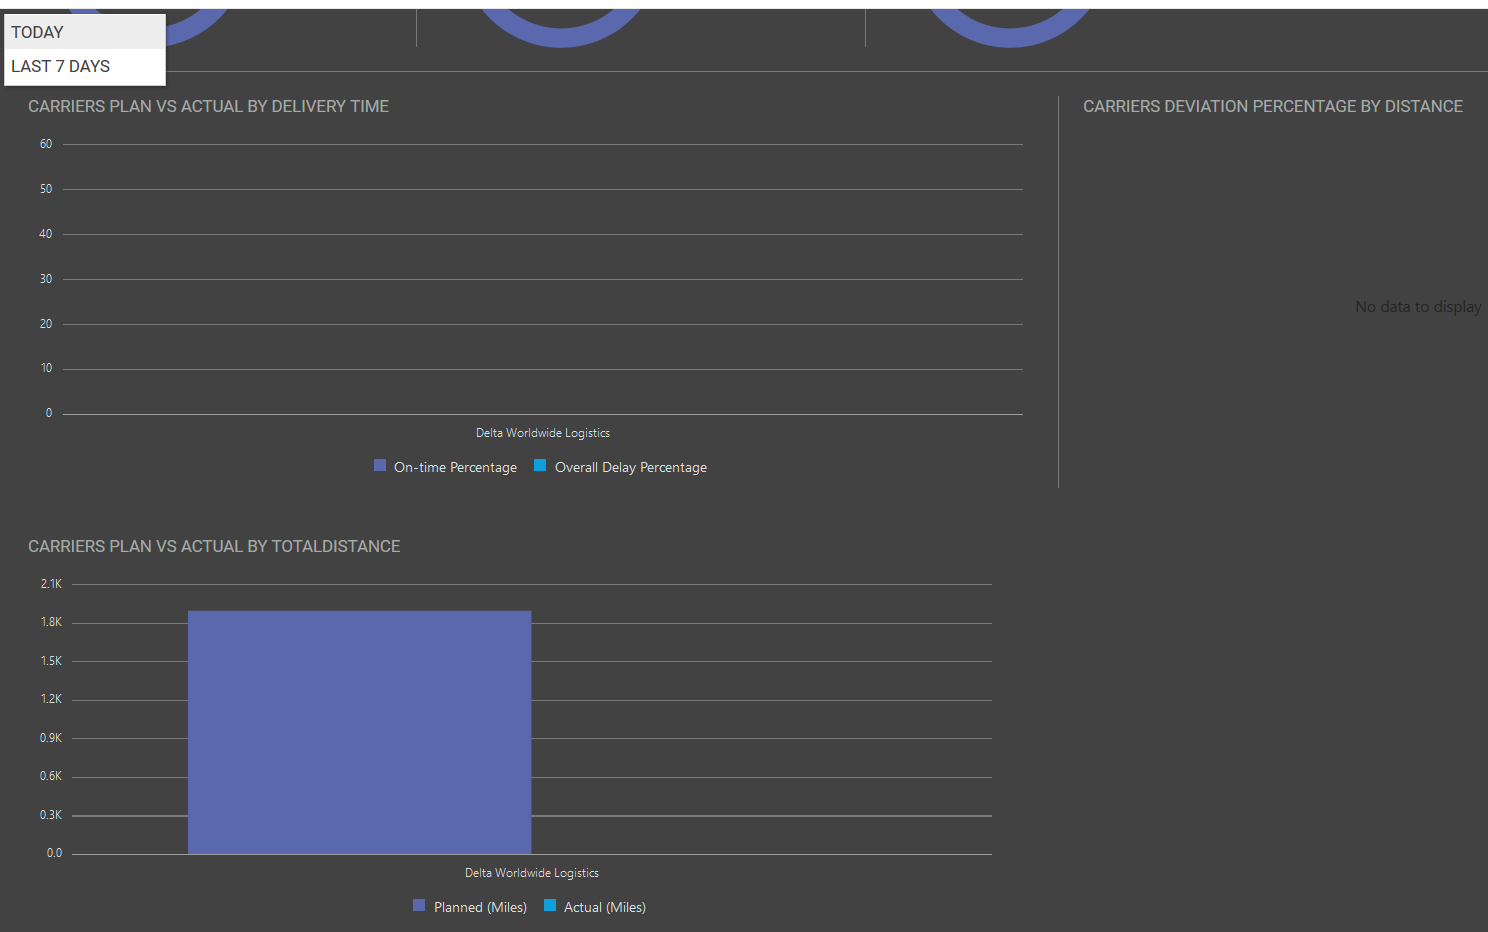
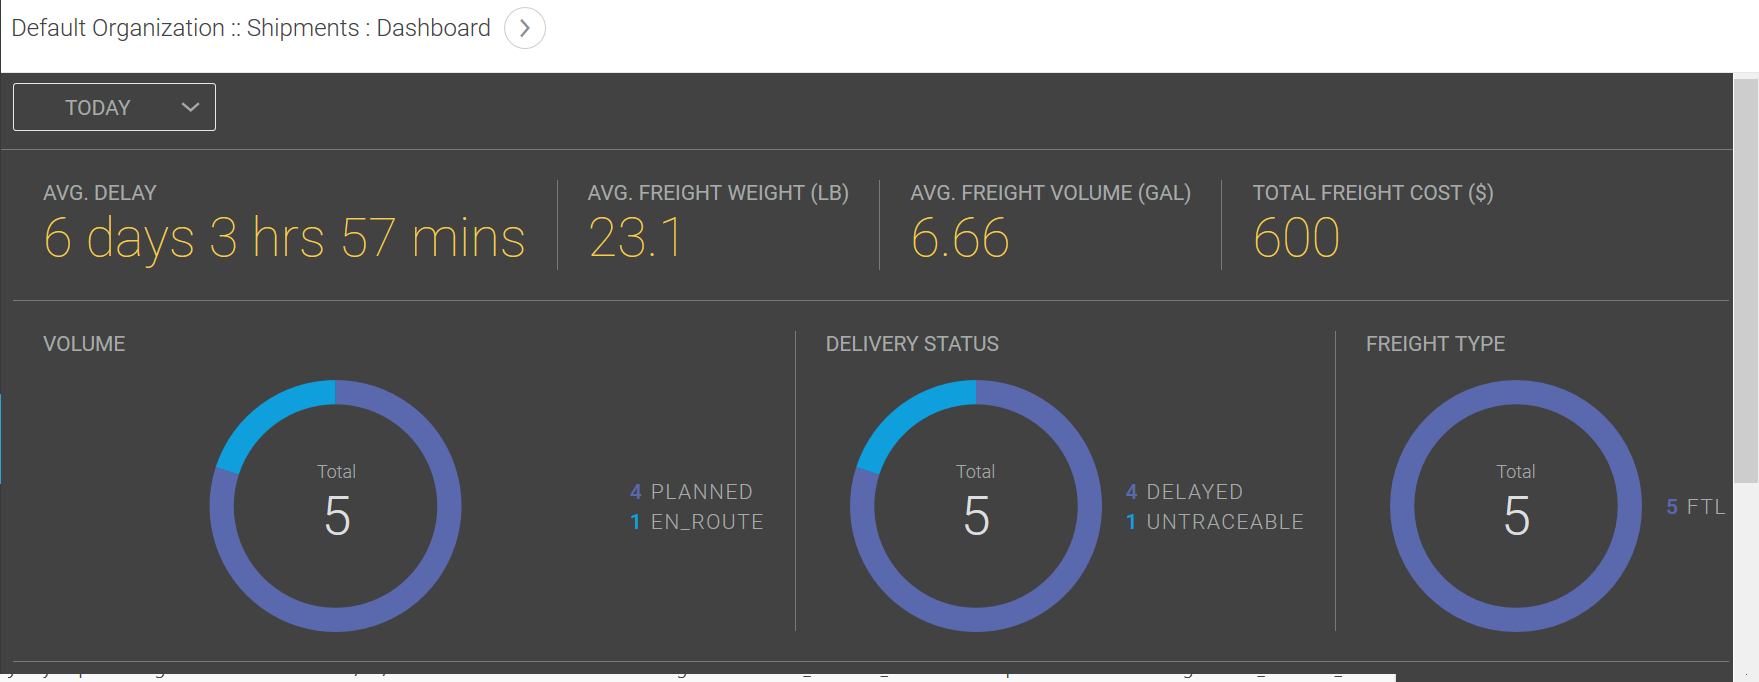
View the shipments dashboard to quickly determine shipment performance for the current day or the previous seven days. The key performance indicators (KPIs) displayed on the dashboard include average delay, average freight weight, average freight volume, total freight cost, total number of completed shipments, freight type, and delivery status of the shipments in the current organization. Additionally, the dashboard displays cumulative graphical data of carriers' plan versus actual by delivery time and by total distance. The carriers' deviation percentage by distance is also displayed.

The administrator or an integrator should have configured an integration with Oracle Transportation Management Cloud Service and the assigned drivers should have started the imported shipments. You should be on the Operation Center view of the current organization.
  1. From the Operation Center menu options, click Shipments: Dashboard Shipments Dashboard icon
    The performance metrics are displayed on the dashboard. Shipments: Dashboard with performance metrics
  2. (Optional) To display data for the previous seven days, click Today and then select LAST 7 DAYS. Scroll down to view the remaining performance metrics.
    Cumulative data is displayed in a graph.Shipments Dashboard graphical data

View Shipment Details for All Shipments

View the Shipments dashboard to quickly determine the status of all shipments, including the distance traveled, delays, transportation cost, and the driver assigned to the shipment. Shipper (IoTFMShipper) permissions are required to view shipment details.

View the details of all the shipments imported from Oracle Transportation Management Cloud Service from the Operation Center of the current organization.
  1. From the Operation Center menu options, click Shipments (Shipments icon) .
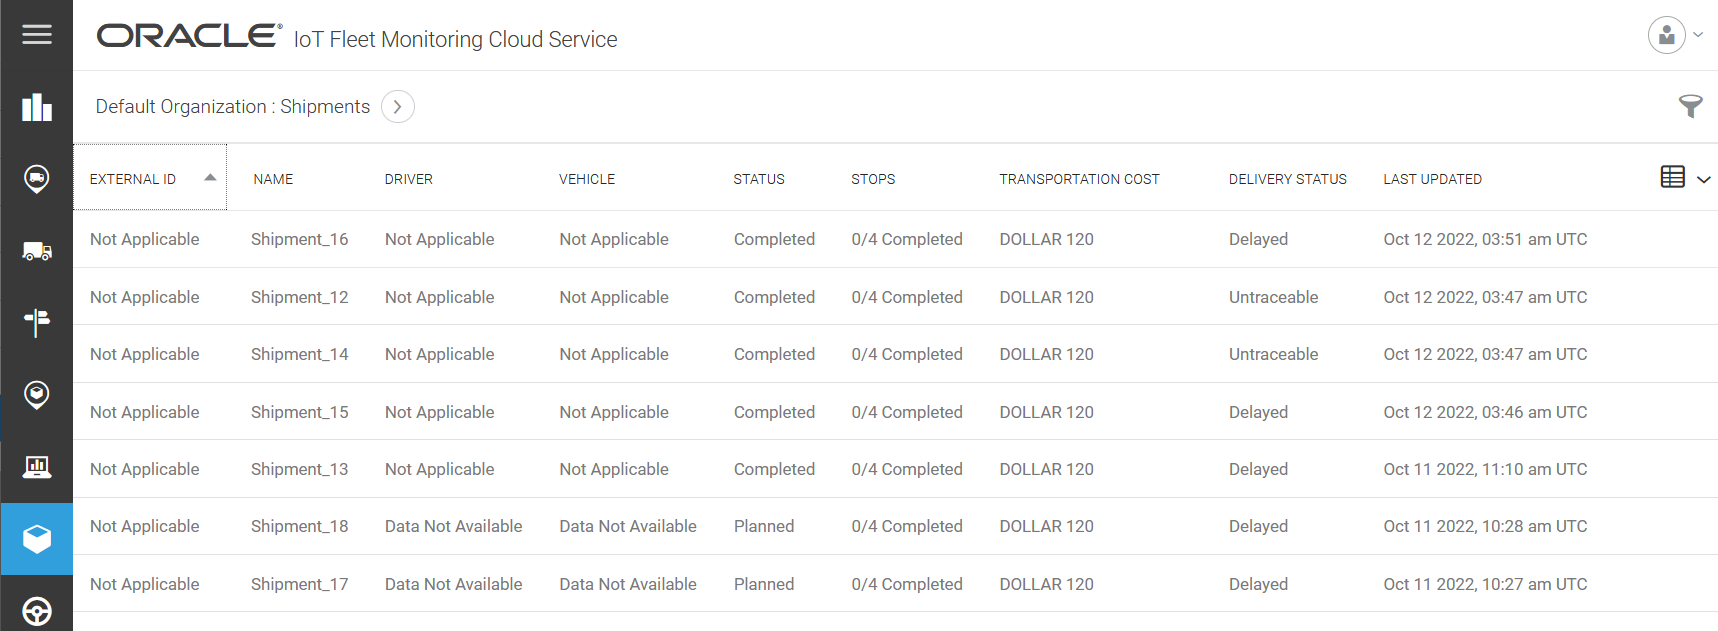
    The Shipments page displays the details such as assigned driver name, vehicle number, number of stops completed, status, transportation cost, delivery status, and so on.Details of all shipments
  2. To search for shipments that match a criteria, click Filter (Filter icon).
    The Filter dialog is displayed.
  3. From the Filters dropdown list, select one of the values such as Name, Domain Name, External ID, Driver Name, and so on.
  4. From the secondary options, select a suitable operator such as contains, matches, does not contain, starts with, does not match, is, and is not.
  5. Enter the search term in the adjacent field.
    The shipments that match your filter criteria are listed.
  6. Review the details of the filtered shipments. Click Clear Filter to remove the search criteria.

View Shipment Details

View shipment details of a specific shipment, including the distance traveled, delays, transportation cost, the driver assigned to the shipment, vehicle number, carrier name, address of each stop, the estimated time of arrival and departure at each stop, and number of stops completed. Shipper (IoTFMShipper) permissions are required to view shipment details.

View the detailed information about a specific shipment from the Shipments option in the Operation Center.
  1. From the Operation Center menu options, click Shipments (Shipments icon).
    The Shipments page displays the details including assigned driver name, vehicle number, number of stops completed, status, transportation cost, and delivery status.
  2. To view details of a specific shipment, select a shipment and then click View (View icon).
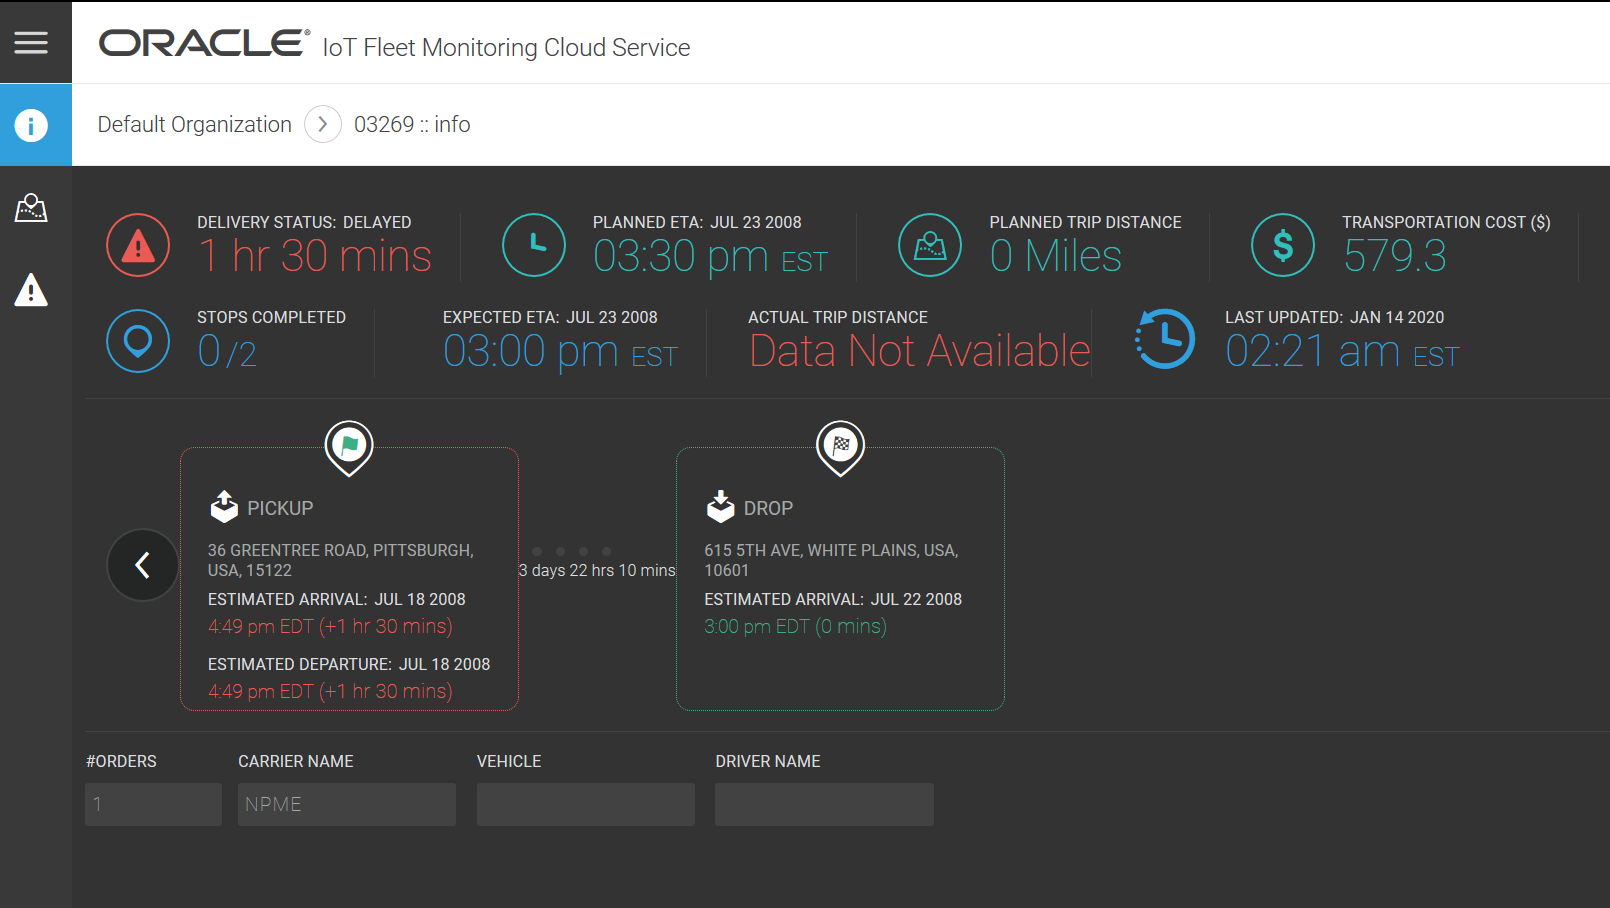
    The info view of the shipment displays the details including delivery status, planned ETA, planned trip distance, transportation cost, stops completed, expected ETA, actual trip distance, last updated time, the carrier name, vehicle number and the driver name. It also displays the address of the stops, their estimated arrival and departure time.Shipment_Info page
  3. (Optional) Click Map (Map icon) to view the shipment route in a map view.
  4. (Optional) Click Incidents (Incidents icon) to view incidents associated with the shipment.
  5. (Optional) Click the organization name on the breadcrumb details to return to the default view of the organization's Operation Center.

View Shipment Route Details

Use the shipment map option to view the route for a specific shipment. Shipper (IoTFMShipper) permissions are required to view the shipment map view.

Go to the map view from the detailed information page of a specific shipment from the Shipments view in the Operation Center.
  1. From the Operation Center menu options, click Shipments (Shipments icon) .
    The Shipments page displays the details including assigned driver name, vehicle number, number of stops completed, status, transportation cost, and delivery status.
  2. To view details of a specific shipment, select a shipment and then click View (View icon).
    The detailed information of the shipment is displayed.
  3. On the left menu bar, click Map (Map icon).
    The Map view of the shipment displays the route, the current location, the pickup, and drop locations of the shipment. Use these icons to search and determine other details on the map:
    • The zoomIn and zoomOut (Zoom-in and Zoom-out icons) icons to magnify in or out of an area
    • The Map Options (Map Options icon) icon to enable or disable the display of geofences and system-created route-fences, and stop-fences. You can effectively monitor the shipment for location pings received within the stop geo-fences, which helps in accurate detection of arrivals and departure events.
    • The Search Geofence (Search icon) icon to enter a specific geofence and determine its location
  4. (Optional) Click Info ( Info icon) to return to the detailed view of the shipment.
  5. (Optional) Click the organization name on the breadcrumb area to return to the Shipment page of the Operation Center.

View Shipment Incidents

Use the shipment incidents option to view incidents reported for a specific shipment.

Go to the incidents view on the detailed information page of a specific shipment from the Shipments view in the Operation Center.
  1. From the Operation Center menu options, click Shipments (Shipments icon) .
    The Shipments page displays the details including assigned driver name, vehicle number, number of stops completed, status, transportation cost, and delivery status.
  2. To view details of a specific shipment, select a shipment and then click View (View icon).
    The detailed information of the shipment is displayed.
  3. On the left menu bar, click Incidents (Incidents icon).
    The list of incidents raised for the shipment is displayed.
  4. (Optional) To filter the incidents list, click a pie chart segment or use a search filter:
    1. Click Filter (Filter icon). In Select Filter
    2. Select Show All, Status, Priority, Type, Description, or Creation Time.
    3. Select is to search for incidents matching the criteria, or select is not to search for incidents that do not match the search criteria.
    4. Select additional search parameters in Select Search Criteria.
    5. (Optional) Click Add (Add icon) or Remove (Remove icon) to add or remove search filters.
  5. (Optional) Click Back to Map to return to the shipment map view.

Search for Shipments in the Map View

Use the filter function in the shipments map view to determine the physical location of a shipment of the current organization.

You should be in the Operation Center area of the current organization.
  1. From the Operation Center menu options, click Shipments Map (Shipments Map icon) .
  2. On the right, above the zoom controls, click the Filter (Filter icon) icon to open the Filters dialog.
  3. From the Filters dropdown list, select one of these search options:
    • Shipment Name: Select this option to search for a shipment by its name.
    • Domain Name: Select this option to search for a shipment that is imported from a specific domain name in Oracle Transportation Management Cloud .
    • External ID: Select this option to search for a shipment with a specific external name.
    • Shipment Status: Select this option to search for a shipment with a specific status.
    • Vehicle Registration No: Select this option to search for a shipment assigned to a vehicle with a specific vehicle registration number.
    • Driver Name: Select this option to search for a shipment assigned to a specific driver.
    • Delivery Status: Select this option to search for a shipment with a specific delivery status.
    • Freight Type: Select this option to search for a shipment that matches a specific freight type
  4. From the secondary options, select a suitable operator such as contains, matches, does not contain, starts with, is, and is not.
  5. Enter the search term in the adjacent field.
  6. (Optional) To add an additional search condition, click the Add (Add icon) icon. For example, search for a shipment in a specific location.
  7. (Optional) To remove search conditions, click the Remove (Remove icon) icon.
    The shipment that matches your search criteria appears on the map. You can use the zoom controls (Zoom-in and Zoom-out icons ) to view the exact location of the shipment and then click View (View icon) beside the shipment to determine its details.

Create a Shipment Rule

Create a rule to generate an incident or alert when a shipment meets or exceeds a set threshold.

In a rule, you select an incident when an action is needed post the notification and select an alert when a notification needs to be sent for information purpose only.
  1. Click the Menu (Menu icon) icon, and then click Design Center.
  2. Click Shipments and then click Rules (Rules icon)
  3. Click Create New Rule (Create New Rule icon).
  4. Enter a name for the rule in the Name field.
  5. Select one of these options in the Apply To list:
    • All Shipments: Select this option to apply the rule to all vehicles.
    • Specific Shipments: Select this option and then select the specific shipment to which the rule should apply.
  6. Select the rule condition(s) in the Condition area:
    • Alert: Select this option to generate an alert when the specified conditions are met or exceeded.
    • Location: Select this option to generate an incident notification when a shipment enters or leaves a a geofence. To create a new geofence, see Create a New Geofence.
    • Attribute: Select an attribute to generate an alert or incident notification.
  7. (Optional) Select additional conditions.
  8. Select these options in the Fulfillment area:
    • All Conditions Apply: Select this option to generate an incident report when all of the conditions are met or exceeded. or select Any Conditions Apply to generate an incident report when any of the conditions are met or exceeded.
    • Any Conditions Apply: Select this option to generate an incident report when any of the conditions are met or exceeded.
    • Incident: Select this option to generate an incident notification when the specified conditions are met or exceeded.
    • Alert: Select this option to generate an alert when the specified conditions are met or exceeded.
  9. If you selected Incident in the Fulfillment area, complete these fields in the Incident Details area:
    • Summary: Enter a summary that describes the rule.
    • Type: Select the rule type.
    • Priority: Select an optional priority for the rule.
    • Tags: Enter optional tags for the rule.
    • Description: Enter an optional description for the rule.
  10. (Optional) If you selected Incident in the Fulfillment area, select subscriber(s) in the Subscribers list in the Notification Subscription area.
    When you add a subscriber, the subscriber receives an SMS incident notification on their mobile device when the rule conditions are met or exceeded.
  11. If you selected Alert in the Fulfillment area, complete these fields in the Alert Details area:
    • Summary: Enter a summary that describes the rule.
    • Severity: Select an optional priority for the rule.
    • Type: Select the severity for generating the alert.
    • Suppression Period: Select the time in minutes to suppress the alert.
  12. (Optional) If you selected Alert in the Fulfillment area, select the data to include with the alert notification:
    • Source Attributes: Select this option to include the source attributes with the alert message.
    • Context Information: Select this option to include context information with the alert message.
    • Message Payload: Select this option to include the message that generated the rule with the alert message.
  13. Select a Rule Schedule.
  14. For the Custom, rule schedule, select these options:
    • Repeat Weekly: The rule will be triggered once every week
    • Repeat Monthly: The rule will be triggered once every month
    • Select cells or drag over the rows to define a data window for the weekly or monthly rule schedule. The rule will use the selected day to trigger and the time range for metric data.
  15. Click Save.
  16. Click Back to return to the Rules list.
    You can view the incidents or alerts generated by a rule from the Incidents and Alerts options in Operation Center.

View All Facilities

View all the facilities from the operation center to quickly determine the average waiting time and average loading time of all facilities.

View the details of all the facilities imported from Oracle Warehouse Management Cloud Service from the Operation Center of the current organization.
  1. From the Operation Center menu options, click Facilities (Facilities icon) .
    The Facilities page displays the details including average loading time in the last 24 hours and average waiting time in the last 24 hours.
  2. To search for facilities that match a criteria, click Filter (Filter icon) to open the Filters dialog.
  3. From the Filter dropdown, select one of the options such as Name, Average Loading Time Last 24 Hours, and Average Waiting Time Last 24 Hours.
  4. From the secondary options, select a suitable operator such as contains, matches, or does not contain.
  5. Enter the search term in the adjacent field and then click Apply.
  6. Review the details of the filtered shipments. Click Clear Filter to remove the search criteria.

View Facility Details

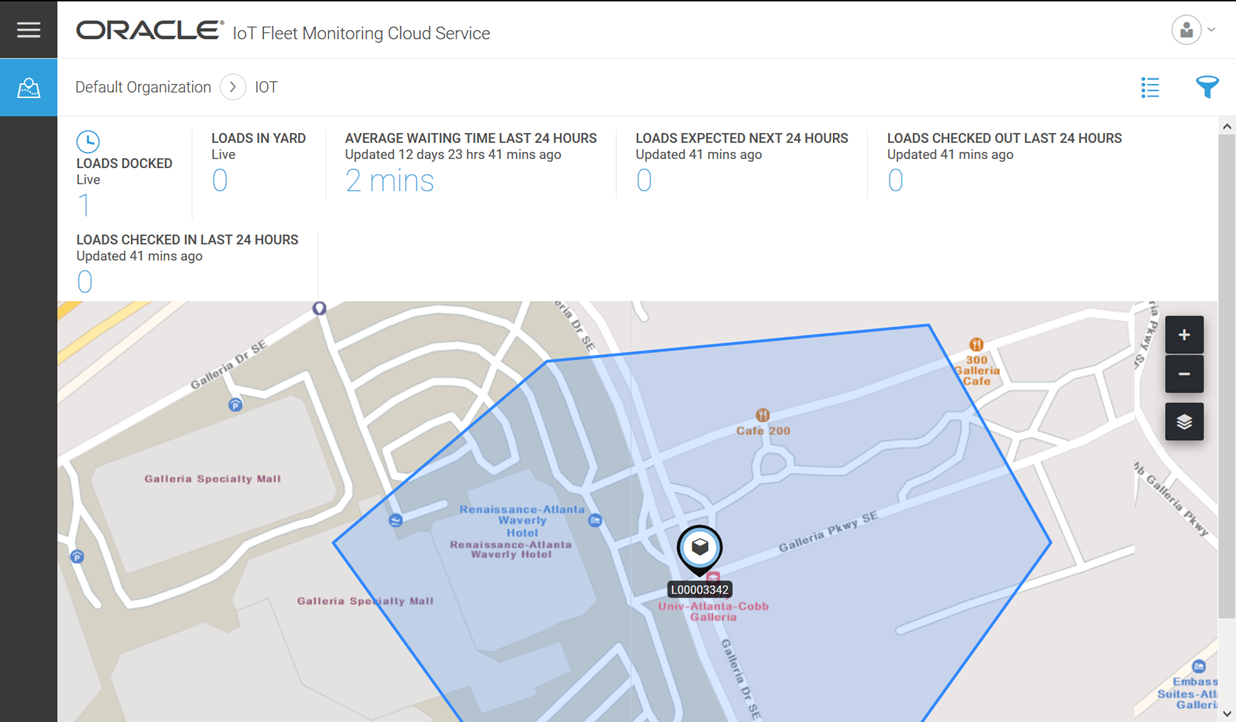
View details of a specific facility including live metrics on number of loads docked, number of loads in yard, average waiting time, loads expected, checked-in, and checked out in the last twenty four hours. View the geofence of the facility on the map and view a list of the loads and their details.
View metrics of a specific facility, its geofence on the map, and its load details in a list from the Facilities option in the Operation Center.
  1. From the Operation Center menu options, click Facilities (Facilities icon).
    The Facilities page displays all the facilities imported into the organization from Oracle Warehouse Management Cloud Service.
  2. To view details of a specific facility, select a facility and then click View (View icon).
    The map view displays the facility in its geofence. Live and cumulative facility metrics that are displayed are; loads docked, loads in yard, loads expected next twenty four hours, average waiting time, loads checked-in, and loads checked-out in last twenty four hours.Facility map page
  3. (Optional) Click List View (List View icon) to view the list of loads and their details. The loads are mapped to the shipments imported from Oracle Transportation Management Cloud Service
    The list view page displays the load number, status, shipment ID, appointment time, checked-in time, and checked-out time.
  4. To search for loads that match a criteria, click Filter (Filter icon).
  5. On the Filter dialog box, select a value in Search Filter
  6. From the secondary options, select a suitable operator such as contains, matches, does not contain, and so on.
  7. (Optional) Click the Add (Add icon) icon to add an additional search condition. For example, search for a shipment in a specific location.
  8. (Optional) Click the Remove (Remove icon) icon to remove search conditions.
  9. On the Filter dialog box, click Apply. Review the details of the filtered loads.
  10. Click Filter (Filter icon), click Clear Filter, and then click Apply to remove the search criteria.
  11. (Optional) Click the organization name on the breadcrumb details to return to the default view of the organization's Operation Center.