Compare Your Factory to Other Factories

Compare the performance of your factory with other factories using the Map view, or with the best and worst performing factories using the Factory view. This comparison lets you understand how your factory is performing and helps you establish objectives for improving the performance.

In the Map view:

  • Zoom in or out until all the factories that you want to compare appear in the map, then click Compare Compare icon located in the Metrics toolbar.
  • You can use the default time period, or select a different period from the Time Time icon list .
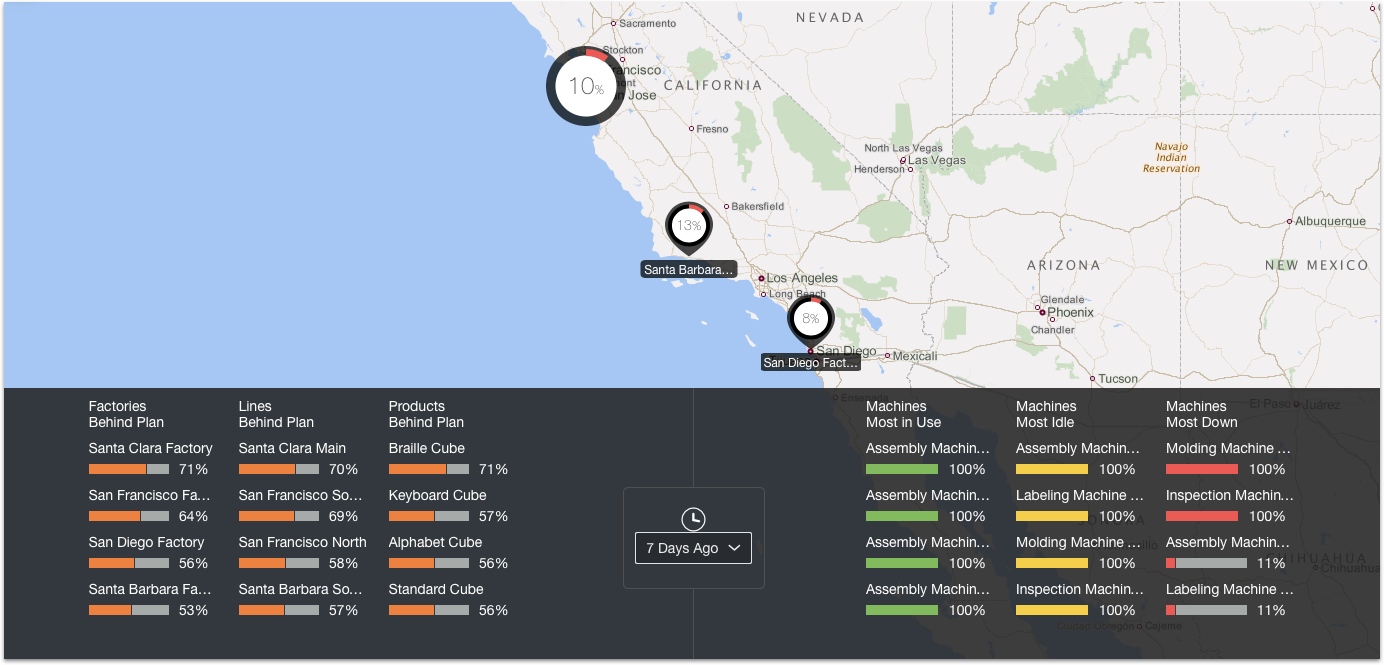
  • Compare the following metrics:
    • Factories behind plan: the percentage of planned production output that was not fulfilled for each of the compared factories.
    • Lines behind plan: the lines with the higher percentage of planned production output that wasn’t fulfilled.
    • Products behind plan: the percentage of planned production that wasn’t fulfilled displayed by product.
    • Machines in use: the machines with the highest usage percentage.
    • Idle machines: the machines with the highest idle percentage.
    • Down machines: the machines with the highest percentage of unavailability.

In the Factory view:

  • Select the Floor Plan Floor Plan icon tab or the Production Production icon tab, and then click Compare Compare icon located in the Metrics toolbar.
  • You can use the default time period, or select a different period from the Time Time icon list.
    A section showing how your factory compares to the best and worst performing factory appears. This comparison is based on the percentage of planned production output that wasn’t fulfilled. This section also shows the machines with the highest percentages of usage, idle time, and down time.

The following image shows a comparison for the last week for all the factories that appear in the map. You can compare the percentage of production behind plan, the percentage of lines behind plan, and the percentage of production behind plan for each product. You can also view the machines that have the greatest percentage of use, idle time, and down time.
This image is described in the surrounding text.