How to Diagnose Production Issues

Identify the factories and machines that are slowing down your production. Start in the map view and drill down to more specific views to isolate the causes of a production incident.

  1. Using the Map view, compare your factories to locate the factory or factories that are causing your productions issues.
    For information about viewing metrics for a group of factories, see Monitor the Performance for a Group of Factories.
    For information about comparing factories, see Compare Your Factory to Other Factories.

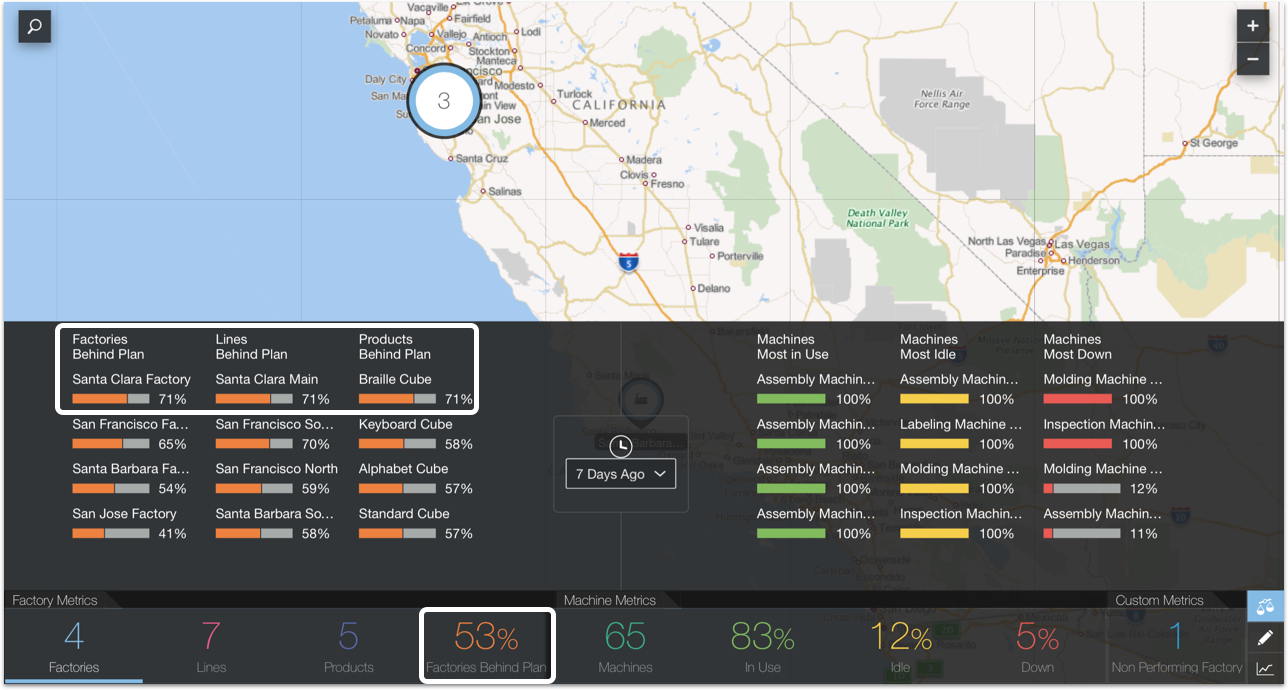
    For example, in this map view 54% of the production is behind plan. If you compare the factories in the map, you can see that the Santa Clara factory is the worst performing factory, 71% of its production is behind plan. Within this factory, the Santa Clara Main production line, and the Braille Cube are the worst performers.

    Diagnosing and fixing the production issues in the Santa Clara factory should improve the overall statistics for your factories.

    This image shows the comparison between the factories and highlights the percentage of factories behind plan (53%) and the worst performing factory (Santa Clara, 71%), production line (Santa Clara Main, 71%), and product (Braille Cube, 71%):

    This image is described in the surrounding text.
  2. Click the factory that has the production issue to view the metrics for that individual factory.
    For information on how to view metrics for a specific factory, see Monitor the Performance of a Specific Factory.

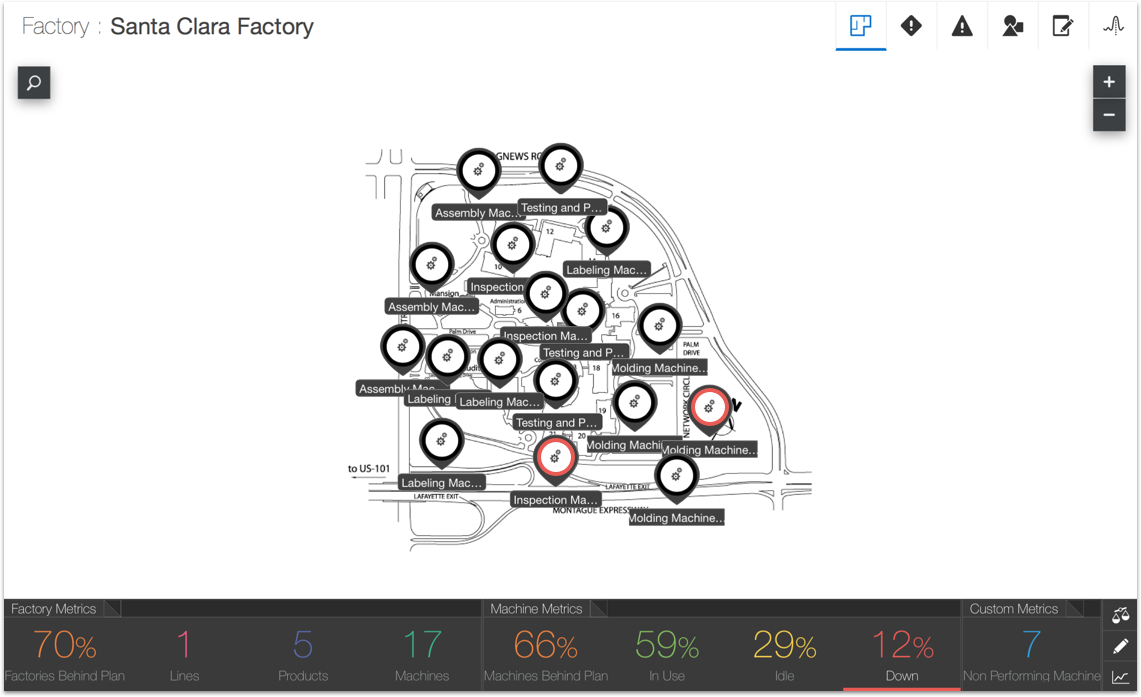
    In our example, expand the Bay Area cluster and click the Santa Clara factory. The Floor Plan view shows that 12% of the machines are unavailable. When you click the Down metric, there are only two machines that are unavailable.

    This image shows the floor plan map of the Santa Clara factory. You can see that there’s a molding machine and an inspection machine that are unavailable.

    This image is described in the surrounding text.
  3. Select the Production Production icon tab to identify the machines that may be causing a bottleneck and slowing down the whole production process.
    For information on the product routing diagram, see View the Product Routing.

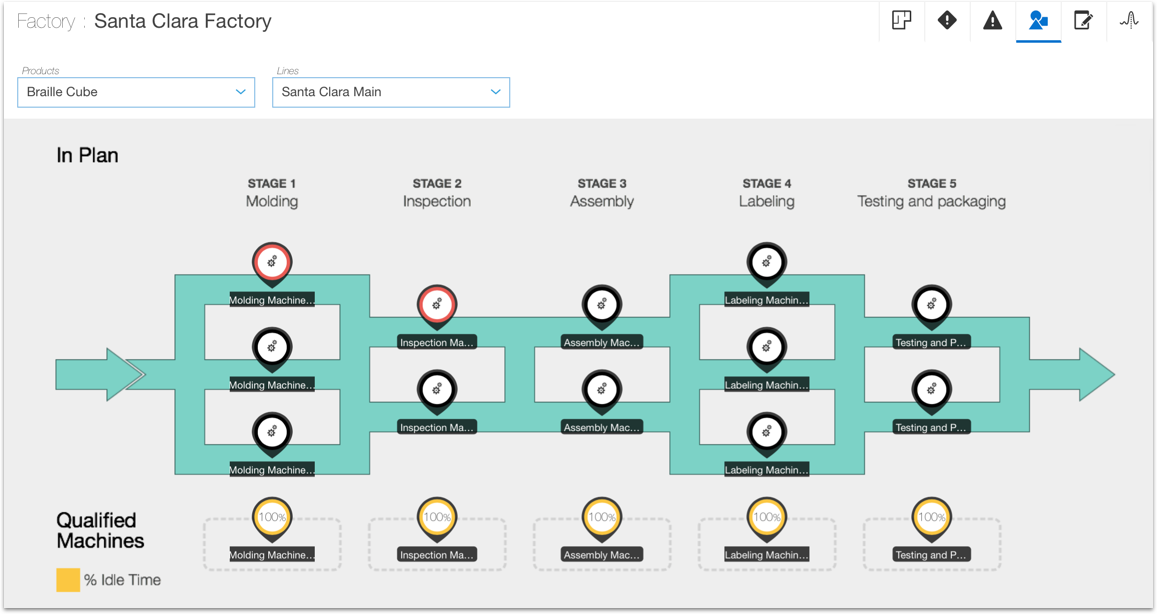
    In our example, we know from the comparative view that the production line that is not performing is the main line and that it’s specifically having issues with the Braille Cube.

    In the product routing diagram for Braille Cube and the main line, we can see that the molding machine in stage 1 and the inspection machine in stage 2 are unavailable. This is a bottleneck and fixing it might help improve the overall performance of this factory.

    This image is described in the surrounding text.
  4. Check the Qualified Machines section to identify machines that can replace the unavailable ones.
    In our example there is a molding machine and an inspection machine available. We can check with the technician responsible for those machines to use them for production.
  5. Use the sensor data of the machines causing the production issue to diagnose the root cause of the problem.

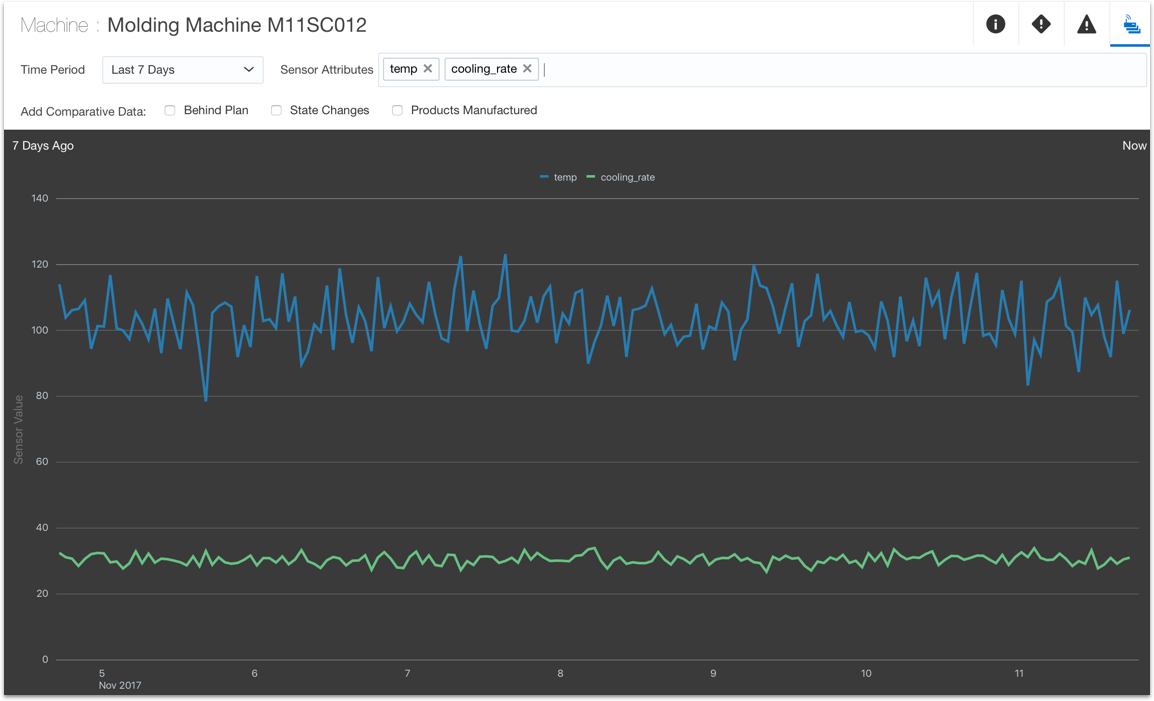
    In our example, the sensor data for the M11SC012 machine shows that the temperature varies between 40 F and 200F. This indicates the machine is very unstable. The cooling rate also varies between 15 F and 45 F which indicates an abnormal behavior.

    The maintenance technician can use this information to repair the machine. They can access this information from the mobile app while they are repairing the machine on the field.

    This image is described in the surrounding text.
  6. Review the incidents and warnings for that machine.
    The incidents and warnings might help you understand why a machine became unavailable. You can also identify which values you must monitor to identify a machine that it’s going to break down.
    For more information on viewing incidents, see View Incidents.
    For more information on viewing warnings, see View Warnings.
After you identify the production issue, you can use the information you gathered to define rules that trigger incidents and warnings before the production issue appears. The rules monitor certain metrics and when the conditions associated with a production issue appear again they trigger a warning or an incident. For information on incidents and warnings, see What are Incidents, Warnings, and Alerts?.