Monitor the Performance for a Group of Factories
You can monitor various metrics for all the factories displayed in the map. You can also view how the different factories contribute to the total value for a certain metric.
In the map view zoom in our zoom out include all the factories you want to monitor in the map. The Factory Metrics and Machine Metrics will display the values for all the factories displayed in the map.
You can click each metric to see how the different factories participate in that total value.
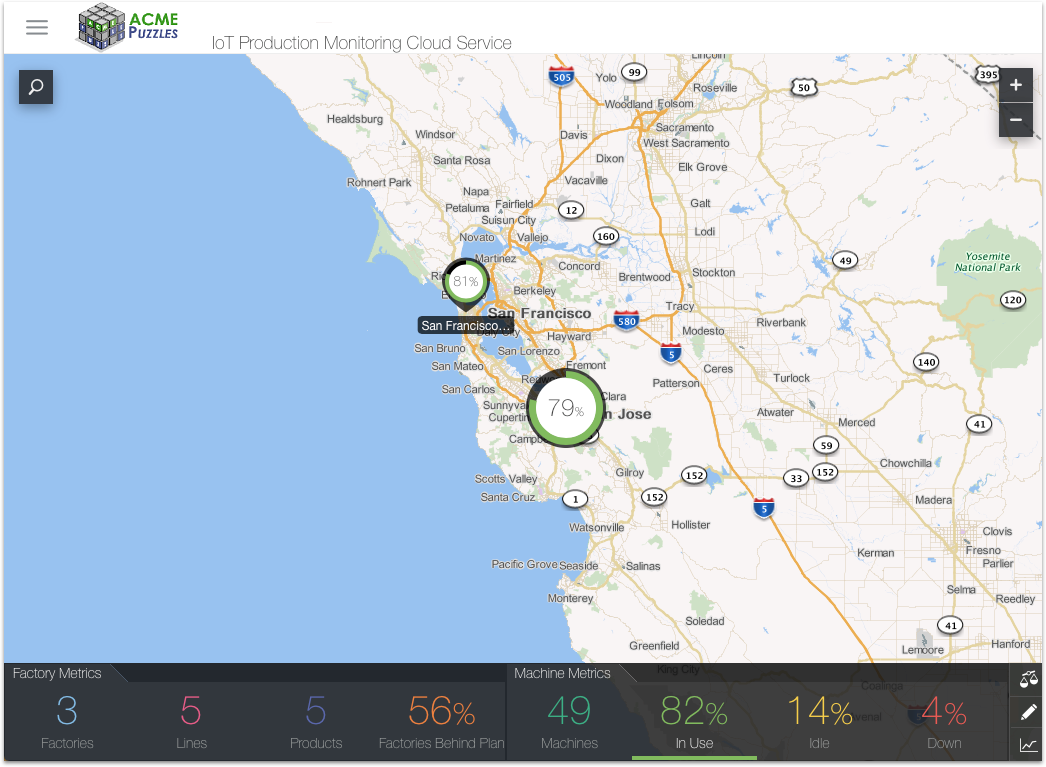
The following image shows the Map view with an individual factory and a cluster containing multiple factories. The In Use metric is selected, so the factory and the cluster of factories display the percentage of machines that are currently manufacturing products.

Depending on the metric you select, the factory icons and the clusters of factories display the following:
| Metric | Type | Displayed Value |
|---|---|---|
| Factories | Factory |
The number of factories included in each cluster on the map. |
| Lines | Factory |
The number of production lines available for each individual factory or cluster of factories. |
| Products | Factory |
The number of different products produced in an individual factory or cluster of factories. |
| Factories Behind Plan | Factory |
The percentage of the projected production output that was not fulfilled for that individual factory or cluster of factories. |
| Machines | Machine |
The total number of machines in that individual factory or cluster of factories. |
| In Use | Machine |
The percentage of machines that are in use for that individual factory or cluster of factories. |
| Idle | Machine |
The percentage of machines that are idle for that individual factory or cluster of factories. |
| Down | Machine |
The percentage of machines that is unavailable for that individual factory or cluster of factories. Machines can be unavailable due to maintenance or mechanical issues. |