Monitor a Specific Factory
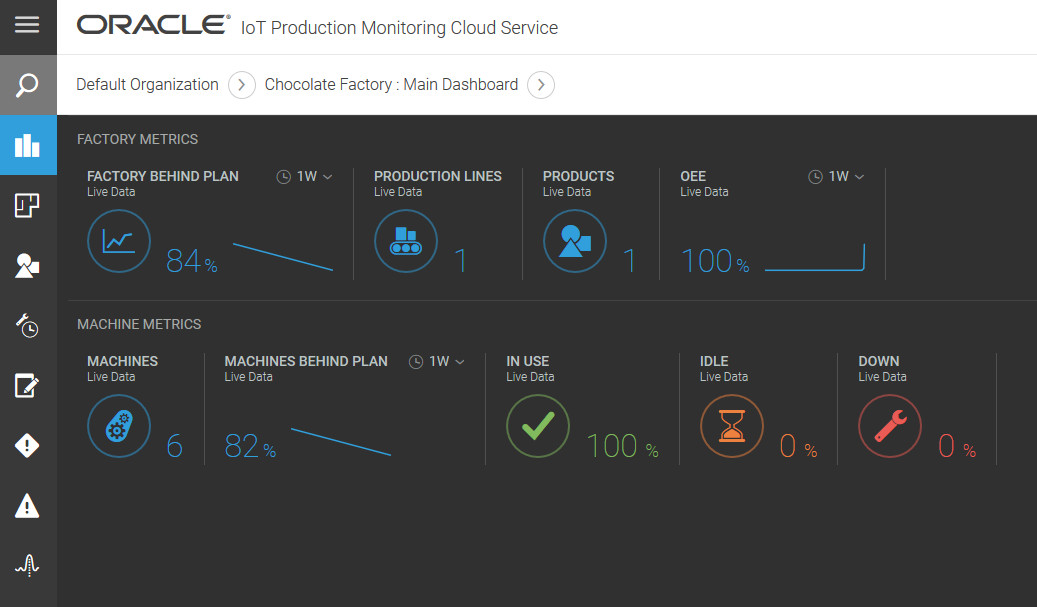
For each of your factories, you can view the factory metrics and machine metrics on the main dashboard. You can also see the floor plan, maintenance schedules, incidents and warning reports, product routing data, the digital birth certificate, and anomalies for the factory.
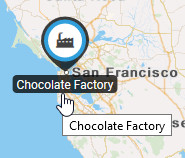
Locate your factory in the Operations Center Map view. You might need to zoom in our out, and click to expand clusters of factories until you find your factory. Click your factory icon in the map.

The main dashboard for the factory appears by default.
Note:
You can change the visualization options in the factory settings if you want a different page to appear by default. For example, you may want the floor plan page to appear as the default view.
The ready-to-use dashboard includes common factory and machine metrics. You can include other system metrics by editing the dashboard in the Design Center. For example, you can add system metrics for the number of completed or reject product quantities. You can also add custom metrics to the dashboard.
Note:
You can create additional custom dashboards in the Design Center.Several metrics have accompanying charts. Click a chart to open it in a pop-up window. You can choose predefined or custom time periods for your charts.
Note:
When selecting time periods for your sensor and metric charts, the values available depend on the data life spans for your sensor and metric data. You can view data up to a maximum of six months if the storage life span for your sensor and metric data exceeds six months.In addition to the main dashboard, there are several tabs, or views, available for your factory. The following table summarizes these tabs.
| Tab Name | Icon | Description |
|---|---|---|
| Main Dashboard |
View the factory metrics and overall machine metrics at a glance. You can customize the factory dashboard in the Design Center to add or remove metrics. |
|
| Floor Plan |
View how the machines are distributed in your factory. You can select different metrics to see how your machines contribute to the toal value, see Monitor the Performance of a Specific Factory. |
|
| Incidents |
View the incidents report for this factory. You can filter the list of warnings by specifying one or more search parameters. |
|
| Warnings |
View the warnings report for this factory. You can filter the list of warnings by specifying one or more search parameters. |
|
| Production |
View the machines involved in the production of a specific product. You can also monitor the different metrics for a specific product and product line to understand how the different machines contribute to the total value of that metric. See Monitor the Performance of a Specific Factory. |
|
| Reports |
Create a digital birth certificate to track the production of each machine for a certain product in a specific period of time. |
|
| Anomalies |
View the anomalies report for that factory over a certain period of time. |
|
| Search | Lets you search for factories, machines, and locations. |