Use Statistical Trends for Machine Attributes

You can create statistical trends for your machine attributes using one or more Nelson Rules. These may help you analyze the consistency and predictability of your attribute values.

Trends use a set of Nelson Rules along with your machine type and attribute to be analyzed. For example, you may wish to analyze the trends for the pressure, temperature, or vibration sensor values of your machine. You can choose one or more of the following Nelson Rules that are relevant for your machine attribute:

  • Nelson Rule 1: One point is more than three standard deviations from the mean.
  • Nelson Rule 2: Nine, or more, points in a row are on the same side of the mean.
  • Nelson Rule 3: Six, or more, points in a row are continuously increasing or decreasing.
  • Nelson Rule 4: Fourteen or more points in a row alternate in direction, increasing then decreasing.
  • Nelson Rule 5: Two or three points in a row are more than two standard deviations from the mean in the same direction.
  • Nelson Rule 6: Four, or five, out of five points in a row are more than one standard deviation from the mean in the same direction.
  • Nelson Rule 7: Fifteen points in a row are all within one standard deviation of the mean on either side of the mean.
  • Nelson Rule 8: Eight points in a row exist, but none within one standard deviation of the mean, and the points are in both directions from the mean.
View Trends

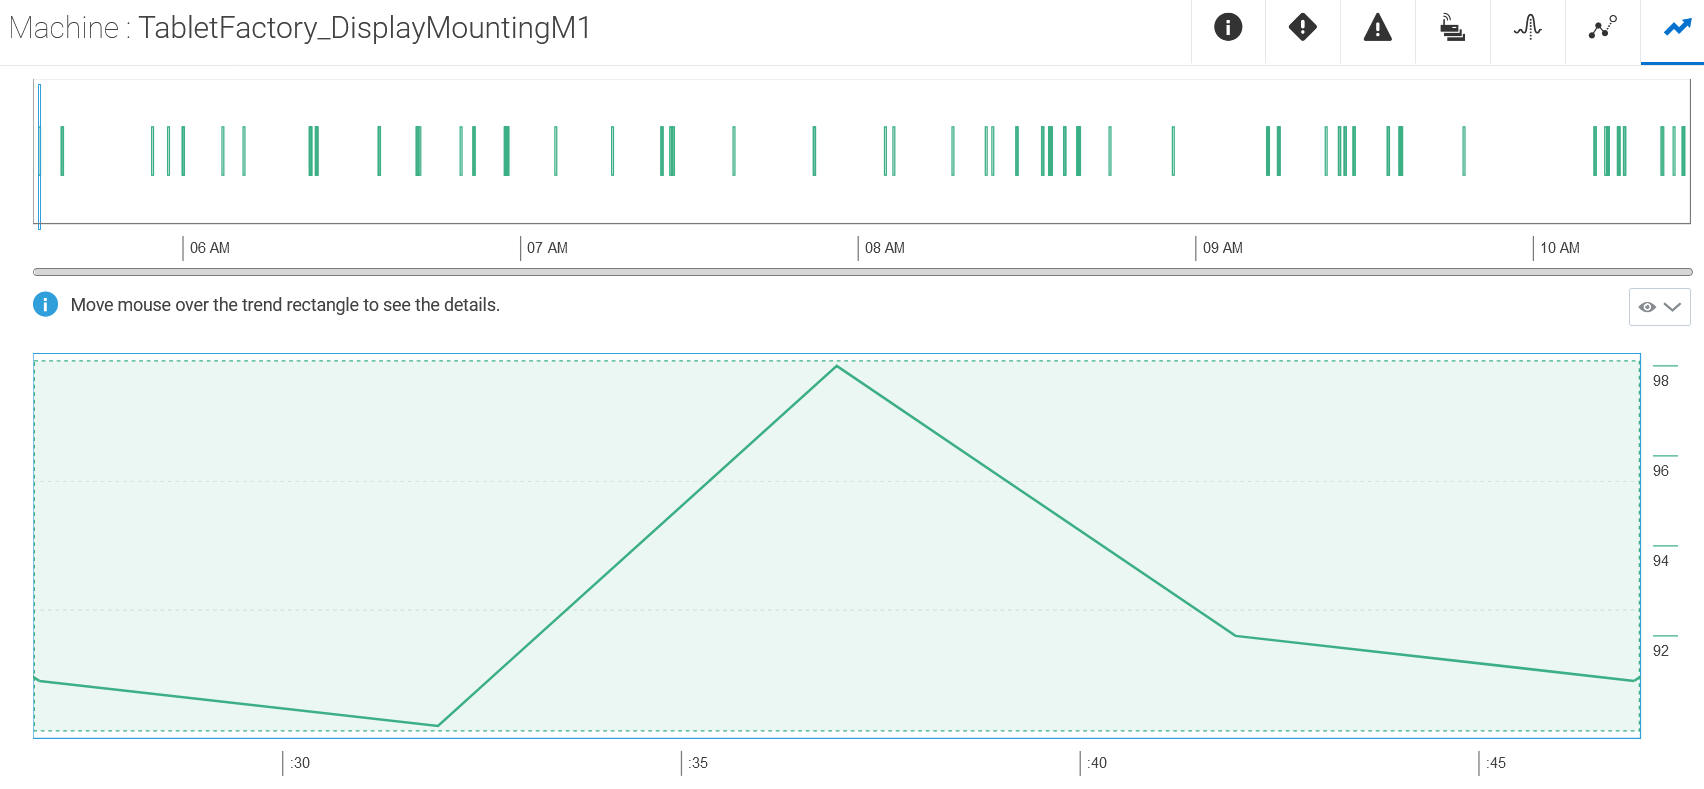
Trends are available in the corresponding machine view of the machine attribute.

In the Floor Plan Floor Plan icon view, or in the Production Production icon view for a factory, click the icon for the machine you want to monitor. Then select the Trends Trends icon tab to look at the machine attribute trends.


Trends Page with plotted points.

Define a Trend

You need to define a trend before the trend model can be created for the machine attribute that you wish to monitor.

  1. Click Menu Menu icon and then click Design Center.
  2. Select Organization from the Design Center menu.
  3. Click Trends Trends icon.
  4. Click Add Add icon.
  5. Enter a name for the trend in the Name field.
  6. (Optional) Specify an optional Description text for the trend.
  7. (Optional) Under Configuration, select a value under Keep Metric Data For.
    If you have unique storage requirements for historical data related to this trend, you can select an option that is different from the global settings defined under Storage Management on the application Settings page.
    For example, if you are calculating trends across a large number of machines, and the trends data is not required beyond a month, then you can select 30 Days under Keep Metric Data For to optimize storage.
  8. Under Configuration, select the Machine Type for your trend.

    The trend applies to all machines of the chosen machine type.

  9. Select the corresponding machine Attribute to monitor.
  10. Select a value for Detection:
    • Automatic: Automatically chooses trends corresponding to all available Nelson Rules.
    • Select Specific Trends: Lets you select one or more individual Nelson Rules that are relevant for your machine attribute.
  11. If you chose Select Specific Trends in the previous step, then select one or more Nelson Rules for your Trends.
    The description and graphical depiction of each rule are shown for you.
  12. Under Training, select the Data Window.

    The Data Window identifies the data set that is used to train the system for trend detection.

    • Static: Uses a static data window to train your trend model. If you have golden data from a period when your machine worked normally, you can use the same to specify a static window. Select the Window Start Time and Window End Time for your static window period.

      The static data window provides data for a one-time training of your trend model. If your definition of normal data changes in the future, you should edit the Data Window for the trend, so that the model can be re-trained.

    • Rolling: A rolling data window uses data from a rolling time window to pick the most recent data for training. For example, you can choose to train your trend model with a rolling data window of the last 7 days, and choose to perform the trend training daily.

      When you use a rolling window, the training model is re-created periodically, as determined by the schedule frequency that you choose.

      • Rolling Window Duration: The duration of the rolling window going back from the model training time. For example, if you select 7 Days, then the last 7 days of specimen machine data is used to train the trend model.
      • Schedule: The frequency of the trend model training. For example, if you choose Daily, then the training happens every day at 00:00 hours (midnight), UTC time by default.
  13. Click Save to save the trend definition.