12 Manage Workers, Locations, and Projects in the Map View and Workers View

Use the map view to locate and manage your workers, locations, and projects.

Use the Personnel and Projects Ribbon

Personnel and project metrics are displayed in a ribbon at the bottom of the map view. Use the metrics ribbon to quickly locate personnel and projects.

  1. Click the Menu (Menu icon) icon, and then click Map.
  2. (Optional) Click the Zoom in (Zoom in) icon to zoom in to a map location, or click the Zoom out (Zoom out icon) icon to zoom out from a map location.
    To include all available workers or projects in your search, zoom out until all continents are visible.
  3. To locate workers or incidents, select one of these options on the Personnel tab:
    • Workers: Select this option to view all of the workers in the current view. The numeric value indicates the number of workers in the current view. When map magnification is low, workers in the same geographic location are grouped in clusters.
    • Incidents: Select this option to view all of the incidents in the current view. The numeric value indicates the number of incidents in the current view. When map magnification is low, incidents in the same geographic location are grouped in clusters.
  4. To locate projects, locations, and hazardous locations, select one of these options on the Projects tab:
    • Projects: Select this option to display the number of projects in the selected view. The numeric value indicates the number of projects in the current view.
    • Locations: Select this option to display the number locations in the selected view. The numeric value indicates the number of locations in the current view.
    • Hazardous: Select this option to display the hazardous locations in the selected view. The numeric value indicates the number of hazardous locations in the current view.

Locate Workers, Projects, and Locations in the Map View

Use a search filter to locate a worker, a project, or a location in the map view.

  1. Click Menu Menu icon, and then click Map.
  2. (Optional) Click Zoom in Zoom in to zoom in to a map location, or click Zoom out Zoom out icon to zoom out from a map location.
    To include all available workers or projects in your search, zoom out until all continents are visible.
  3. Click Filter map content Filter icon.
  4. Select Show All and then select one of these options in the first list:
    • Employee: Select this option to display all workers that meet the search criteria.
    • Project: Select this option to display all projects that meet the search criteria.
    • Location: Select this option to display all locations that meet the search criteria.
  5. Select one of these options in the second list:
    • is: Select this option to search for a worker, a project, or a location that matches the specified search criteria.
    • is not: Select this option to search for a worker, a project, or a location that does not match the specified search criteria.
  6. Enter the search parameters in the second field and then press Enter.
  7. (Optional) Enter additional search criteria and then press Enter.
  8. (Optional) Click Add Add iconor Remove Remove icon to add or remove search filters.
  9. (Optional) Click Clear Search to remove the search filters.

View Worker Details in the Map View

In the map view, groups of workers are represented by a circle with an integer value. Workers are clustered when they are located in close proximity and the map view magnification is low. Clicking the circle automatically increases the map magnification and displays the individual workers that form the cluster.

  1. Click Menu Menu icon and then click Map.
  2. Select Workers on the Personnel tab at the bottom of the map view.
  3. Search for a specific worker or click Zoom Out Zoom Out iconuntil a circle with an integer value appears. To search for a specific worker, see Locate Workers, Projects, and Locations in the Map View.
  4. Click the worker icon until individual worker icons appear, click a worker Worker icon icon, and then click View View icon.
    The worker details screen has the following tabs:
    • Information Tab Information: Shows details on the worker, such as the worker name, role, email, project name, and location name. Also includes the current worker status, such as whether the worker is On Duty, Off Duty, or On Break. A worker status history is available. You can also see any certifications issued to the worker for project or location access.
    • Position History Tab Position History: Plots the recent position history of the worker on the map. You can adjust the slider to select the time period in minutes.
    • Location History Tab Location History: Helps track the time spent by the worker at different locations in the project area.
    • Sensors Data Tab Sensor Data: Shows the data plots for sensors associated with the worker. You can select the sensor(s) and time period to view. You can also choose to zoom in or zoom out over the time axis.
  5. Click the map to return to the map view.

Display Worker Roles Instead of Worker Names

You can choose to show worker roles in place of worker names in the map view, worker details screen, and in search filters.

Use this option if you need the individual worker names to remain anonymous. Use the Configurable Parameters page to set the worker display mode to anonymous. Note that any rules generating incidents or alerts, for example, will continue to show the worker name in the incident and alert details.
  1. Click Menu Menu iconand then click Design Center.
  2. Click the Configurable Parameters Configurable Parameters tab icon tab.
  3. Select whether the settings apply globally, or to an individual project:
    Global: Applies the settings to all projects.
    Project: Applies the settings to the chosen project. All projects inherit the global settings by default. However, you can change the settings inherited by an individual project.
  4. If you selected Project in the previous step, then choose the name of your project.
  5. Change the Worker Display Mode to Anonymised.
  6. Click Save to save your configuration settings.

View the Worker Position History in the Map View

View the worker Position History dashboard to view worker activity and safety data and position history. In the map view, groups of workers are represented by a circle with an integer value. Workers are clustered when they are located in close proximity and the map view magnification is low. Clicking the circle automatically increases the map magnification and displays the individual workers that form the cluster.

  1. Click Menu Menu iconand then click Map.
  2. Select Workers on the Personnel tab at the bottom of the map view.
  3. Search for a specific worker or click Zoom Out Zoom Out iconuntil a circle with an integer value appears. To search for a specific worker, see Locate Workers, Projects, and Locations in the Map View.
  4. Click the worker icon until individual worker icons appear, click a worker Worker icon icon, and then click View View icon.
  5. Click the Position History Position History tab tab.
  6. (Optional) Move the Position History slider to increase or decrease the position history interval.
  7. Click the map to return to the map view.

View the Worker Location History in the Map View

View the worker Location History dashboard to view location data for a specific period. The worker location history can help determine the efficiency and punctuality of workers.

  1. Click Menu Menu iconand then click Map.
  2. Select Workers on the Personnel tab at the bottom of the map view.
  3. Search for a specific worker or click Zoom Out Zoom Out iconuntil a circle with an integer value appears. To search for a specific worker, see Locate Workers, Projects, and Locations in the Map View.
  4. Click the worker icon until individual worker icons appear, click a worker Worker icon icon, and then click View View icon.
  5. Click the Location history Location history icon tab.
  6. (Optional) Select a period for the location history.
  7. Click the map to return to the map view.

View Sensor Attributes Associated with a Worker

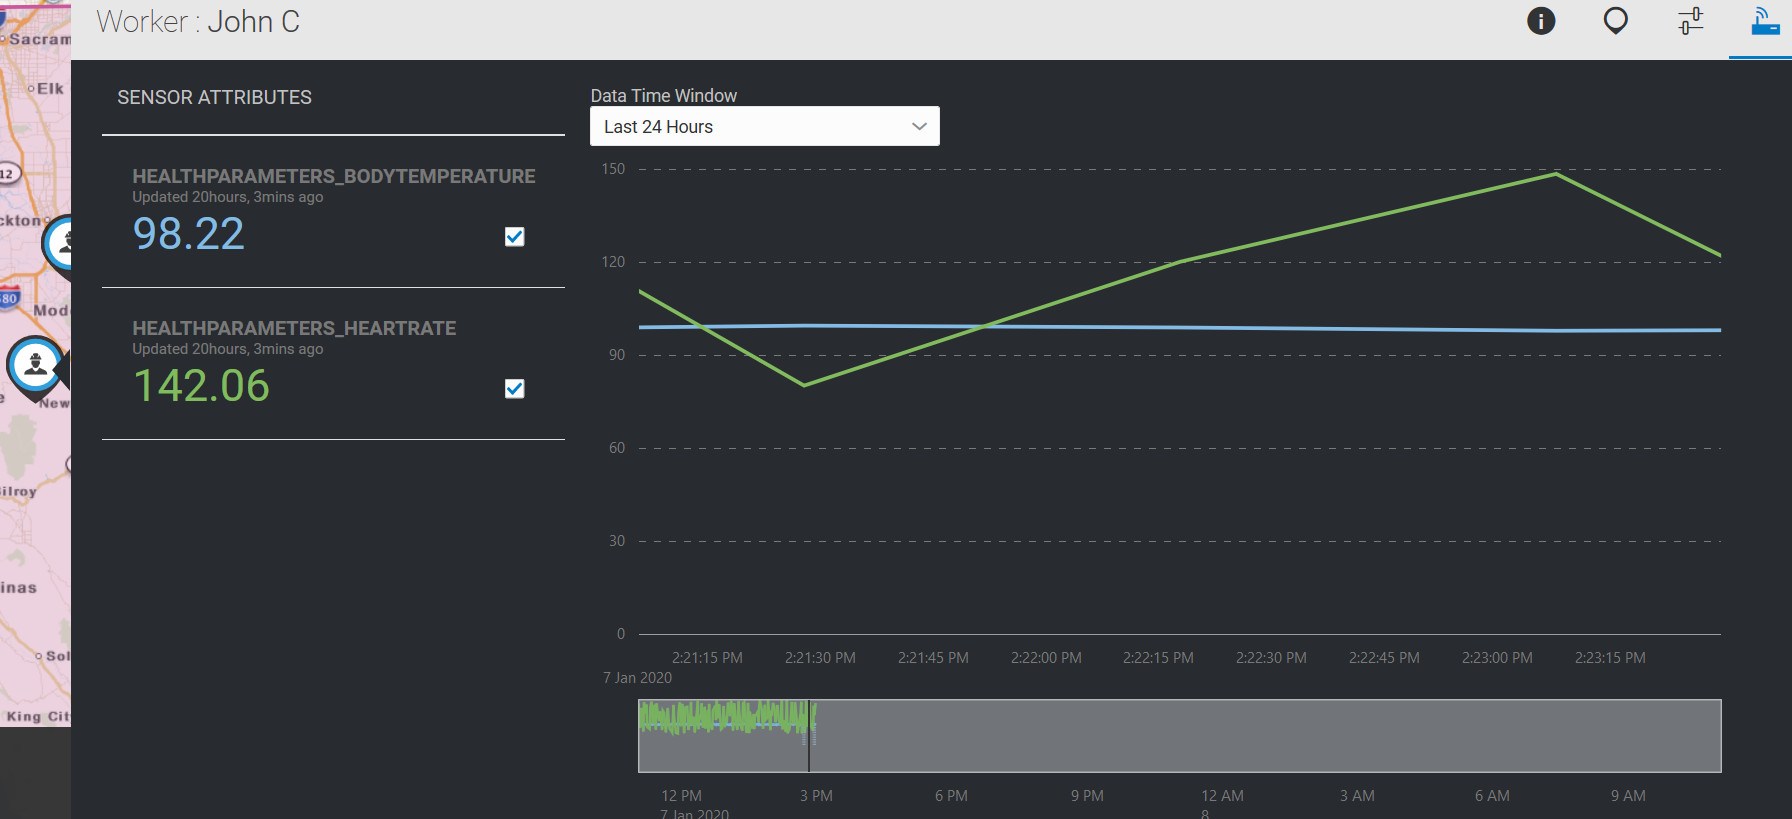
The Sensor Data tab shows data plots for sensors associated with the worker. You can select the sensor(s) and time period to view. You can also choose to zoom in or zoom out over the time axis.

  1. Click Menu Menu iconand then click Map.
  2. Select Workers on the Personnel tab at the bottom of the map view.
  3. Search for a specific worker or click Zoom Out Zoom Out iconuntil a circle with an integer value appears. To search for a specific worker, see Locate Workers, Projects, and Locations in the Map View.
  4. Click the worker icon until individual worker icons appear, click a worker Worker icon icon, and then click View View icon.
  5. Click the Sensor Data Sensor Data Tab tab.
  6. Select the sensor attribute that you wish to see.
    You can select multiple attributes if you are comparing or correlating the values for multiple attributes.
  7. Select a Data Time Window to view sensor data.
    For example, select Last 24 Hours to view the preceding day's data. You can zoom in or zoom out of the data plot.
    Worker Details Screen (with tabs described in text)

    Hover over the data plot at any point to show the attribute name and data values.

  8. Click the map to return to the map view.

Send a Broadcast Message to All Workers in the Map View

Send a broadcast message to all workers in the map view to inform them of important information.

  1. Click the Menu (Menu icon) icon, and then click Map.
  2. Select Workers on the Personnel tab at the bottom of the map view.
  3. Click the Zoom Out (Zoom Out icon) icon until it reaches its maximum setting and all continents are visible.
  4. Click the Broadcast (Broadcast icon) icon.
  5. Enter your message text.
  6. Select the message priority.
  7. Click Send.
  8. Click the Broadcast (Broadcast icon) icon to close the broadcast dialog.

Send a Broadcast Message to Specific Workers in the Map View

Send a broadcast message to specific workers in the map view to inform them of important information.

  1. Click the Menu (Menu icon) icon, and then click Map.
  2. Select Workers on the Personnel tab at the bottom of the map view.
  3. Search for a specific worker or click the Zoom Out (Zoom Out icon) icon until a circle with an integer value appears in the location you want to send your broadcast message. To search for a specific worker, see Locate Workers, Projects, and Locations in the Map View.
  4. Click the circle.
    The map view magnification increases to show the workers contained in the cluster.
  5. Select one of these options:
    • Click the Broadcast (Broadcast icon) icon to send a broadcast message to all workers in the cluster.
    • Click the Worker (Worker icon) icon and then click the Broadcast (Broadcast icon) icon to send a broadcast message the specific worker.
  6. Enter your message text.
  7. Select the message priority.
  8. Click Send.
  9. Click the Broadcast (Broadcast icon) icon to close the broadcast dialog.

Send a Broadcast Message to All Locations in the Map View

Send a broadcast message to all locations in the map view to inform all workers in all locations of important information.

  1. Click the Menu (Menu icon) icon, and then click Map.
  2. Select Locations on the Project tab at the bottom of the map view.
  3. Click the Zoom Out (Zoom Out icon) icon until it reaches its maximum setting and all continents are visible.
  4. Click the Broadcast (Broadcast icon) icon.
  5. Enter your message text.
  6. Select the message priority.
  7. Click Send.
  8. Click the Broadcast (Broadcast icon) icon to close the broadcast dialog.

Send a Broadcast Message to a Specific Location in the Map View

Send a broadcast message to inform workers in specific locations of important information. In the map view, locations in close geographic proximity are represented by a circle with an integer value. Clicking the circle automatically increases the map magnification and displays the individual locations that form the cluster.

  1. Click the Menu (Menu icon) icon, and then click Map.
  2. Select Locations on the Projects tab at the bottom of the map view.
  3. Click the Zoom Out (Zoom Out icon) icon until a circle with an integer value appears in the location you want to send your broadcast message.
  4. Select one of these options:
    • Click a circle and then click the Broadcast (Broadcast icon) icon to send a broadcast message to all workers in all locations in the cluster.
    • Click the location icon until individual location icons appear, click a location icon, and then click the Broadcast (Broadcast icon) icon to send a broadcast message to all workers at the specific location.
  5. Enter your message text.
  6. Select the message priority.
  7. Click Send.
  8. Click the Broadcast (Broadcast icon) icon to close the broadcast dialog.

View Location Details in the Map View

In the map view, locations are represented using location icons. Locations in close geographic proximity are represented by a circle with an integer value, representing the number of locations in the cluster. Clicking the circle automatically increases the map magnification and displays the individual locations that form the cluster.

  1. Click the Menu (Menu icon) icon, and then click Map.
  2. Select Locations on the Projects tab at the bottom of the map view.
  3. Search for a specific location or click Zoom Out (Zoom Out icon) until a circle with an integer value appears. To search for a specific location, see Locate Workers, Projects, and Locations in the Map View.
  4. Click the location icon until individual location icons appear.
    If you have integrated with assets in Oracle IoT Asset Monitoring Cloud Service, then you may also see asset location icons.
    The following image shows an asset location contained in a project location. Notice that the location icons are different for the project location and the asset location. The asset radial boundary also appears around the asset location.

    Location Icons on Map

  5. Click a location icon, and then click View (View icon) to view information for the specific location.
    The Information tab Information Tab shows information about the project, workers, incidents, and hazard conditions associated with the location.
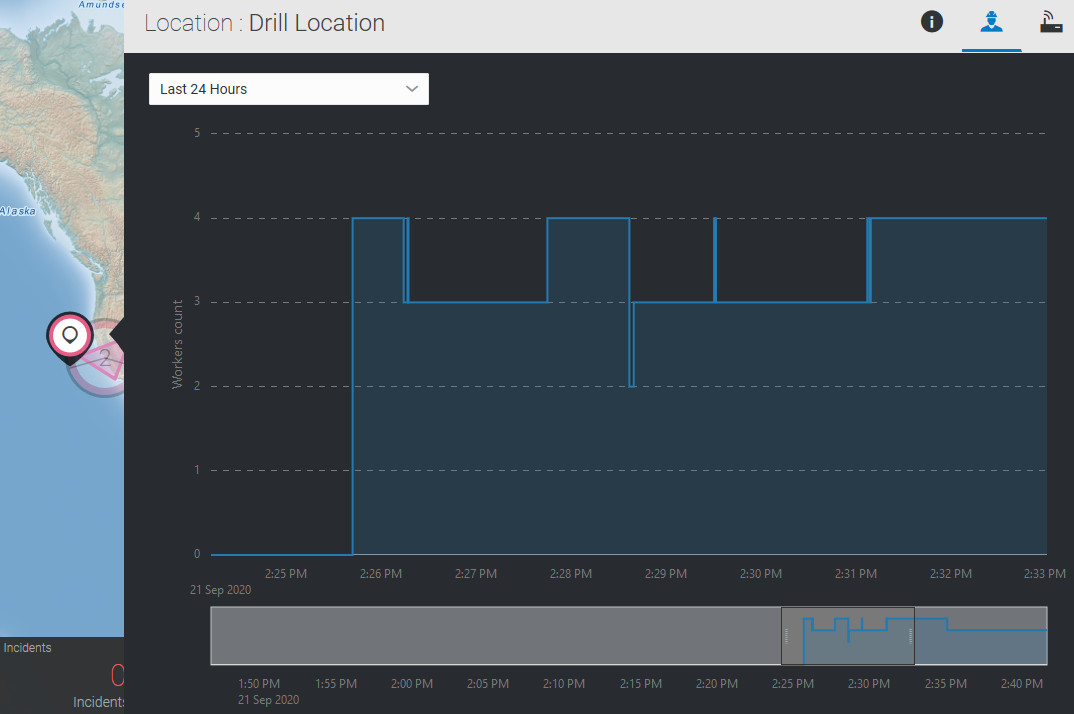
  6. To look at the worker history for the location, click the Workers History Workers History Tab tab.

    Workers History Chart

    The workers history tab shows a time-wise chart of the number of workers present at the project location. Select the time period to view. Alternatively, zoom in or zoom out to see the desired time period.
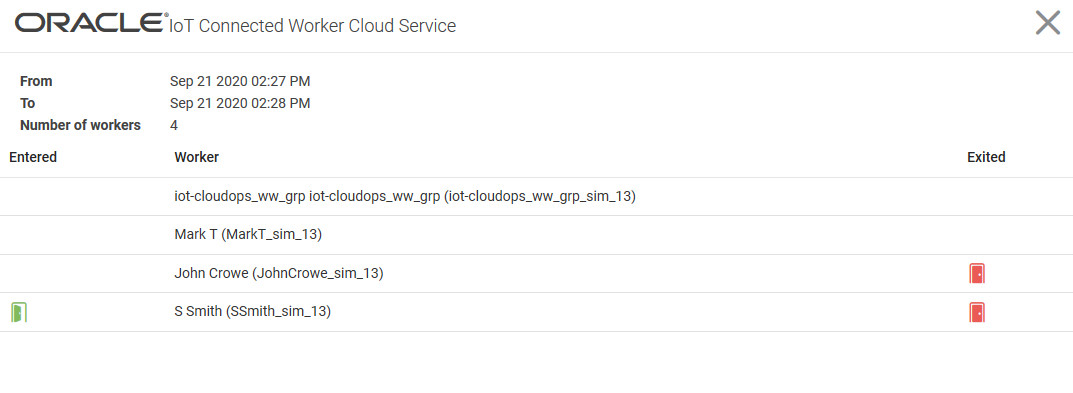
    1. Click and drag in any region of the chart to see a list of workers present for the selected time period. Workers entering or leaving the location during the selected time period are also displayed.

      Worker Details

    2. Click Close (X) to return to the Workers History chart.
  7. To view the data for location-based sensors, click the Sensor Data Sensor Data Tab tab.
    For example, your location may support ambient light, temperature, humidity, and other measurements.

    Note:

    For sensor values to show, your location sensor devices should have been associated with the sensor attributes defined for the location sensor.
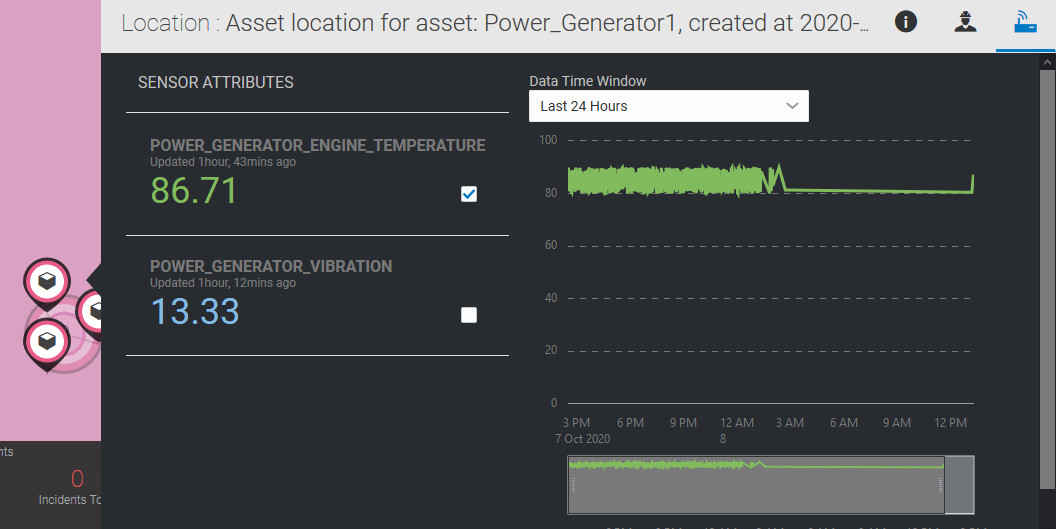
    If you have integrated with assets in Oracle IoT Asset Monitoring Cloud Service, then you can also see asset sensor data for your asset location. The following image shows the sensor data associated with an asset location.
    View Asset Location Sensors

  8. Select the sensor attribute that you wish to see.
    You can select multiple attributes if you are comparing or correlating the values for multiple attributes.
  9. Select a Data Time Window to view sensor data.
    For example, select Last 24 Hours to view the preceding day's data. You can zoom in or zoom out of the data plot.

    Hover over the data plot at any point to show the attribute name and data values.

  10. Click the map to return to the map view.

Display a Floor Plan in the Map View

A floor plan provides a visual representation of the physical space within a location or building. Display a floor plan to identify the specific location of a worker or project participant within a location or building.

  1. Click Menu (Menu icon) and then click Map.
  2. Click Zoom in (Zoom in) or Zoom out (Zoom out icon) to increase or decrease the map magnification.
  3. Select a location.
  4. Click Floor Plan (Floor Plan icon) to display a floor plan.
  5. (Optional) Click Floor Plan (Floor Plan icon) again to hide a floor plan.

Use the Workers Dashboard

The Workers dashboard provides a role-wise and status-wise summary of your workers. The dashboard also includes information on worker projects, worker device statuses, and worker incident statuses.

You can search and filter the list of workers using parameters such as worker name, worker role, or worker status.
  1. Click Menu Menu icon, and then click Workers.
  2. To quickly filter workers by role and duty status, click the appropriate segments in the pie chart under Workers Summary.
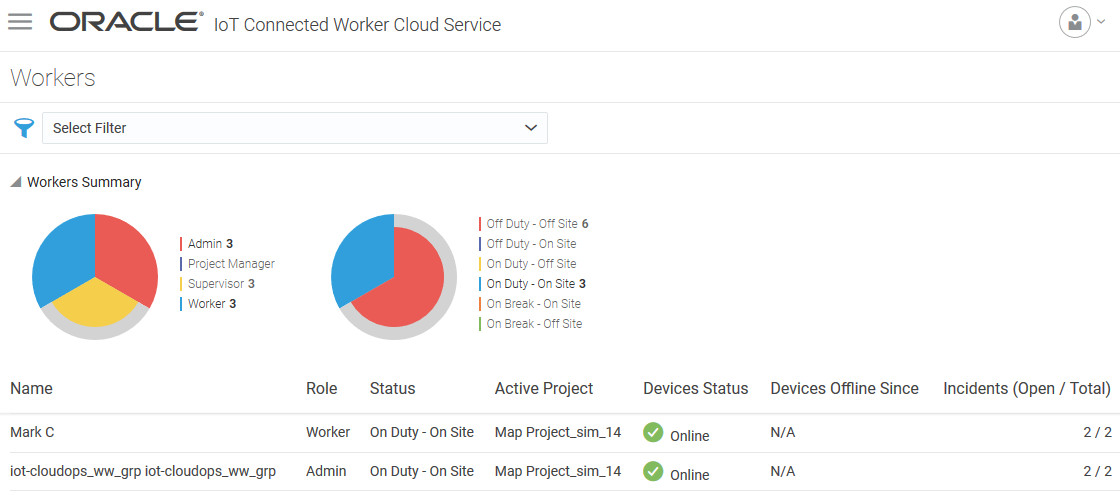
    For example, the following dashboard filters for on-site and on-duty administrators and workers.
    Workers Dashboard (as described in steps)

  3. To search using filters for Name, Role, and Status, use the search filter Filter iconoptions above the Workers Summary section.
    You can combine multiple criteria in your searches.
  4. Click any column header in the workers table below the pie chart to sort the table using that column.
    For example, click Incidents to sort the table by the number of incidents against a worker. You can click the column header again to alternate between ascending and descending order.
    The workers table includes the following details:
    • Name: Name of the worker.
    • Role: Role of the worker, such as supervisor, worker, or admin.
    • Status: Status of the worker, such as on-site or off-site.
    • Active Project: Name of the active project assigned to the worker.
    • Device Status: The device status of the worker's device, such as online or offline.
    • Devices Offline Since: Specifies the duration for which a worker has been offline.
    • Incidents (Open/Total): The count of open and total incidents for the worker.