Using Reports
Use reports to find trends, monitor customer feedback, balance resourcing, monitor engagement durations, and monitor individual performance.
Using Reports to Find Trends
- You can track the number of engagements per device type.
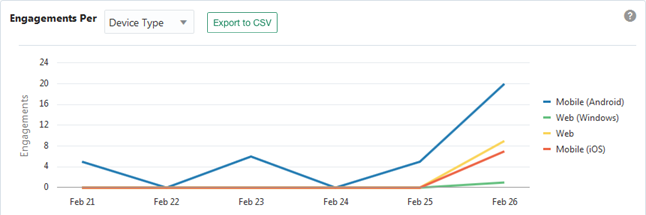
In the above example, one platform is greatly favored over another (Android far outstrips iOS), perhaps meaning that customers are finding one of your particular app platforms less functional.
- You can track engagements by operating system version, which can help you
prioritize support resources.
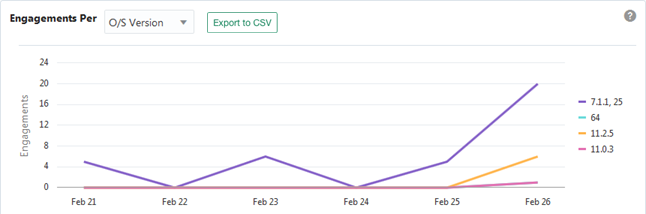
In the graph above, engagements are being generated by Android 7.1 devices at almost 5 times the rate of iOS devices of any version.
- You can identify which locations in your app are generating the most
engagements.
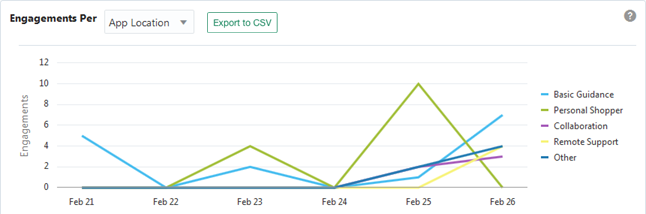
When you add Live Experience to your client app, you can tell Live Experience where the user is in your app by providing a value for the App Location context attribute. When you do this, you are able to track where in your application your customers are choosing to engage with you. For instance you might have an application location for product information, one for product support and another for product purchase and checkout. Using the Engagements Per App Location graph, you can identify at which points in your app your customers are choosing to engage with your associates.
For more details on integrating Live Experience into your own app, see Developing Live Experience.
Collecting and Reporting on Customer Feedback
See Enable Engagement Quality Metrics. See also Search for Engagement Details and Recordings for information about how to search for engagements with a call quality customer feedback filter.
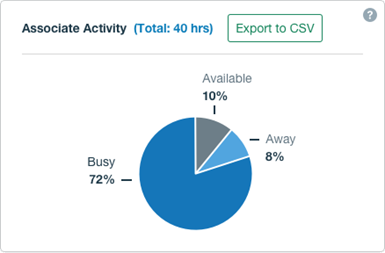
Using Team Reports to Balance Resourcing
The team reports on the Team Performance Report tab are great for helping you make resourcing decisions.
Using Engagement Reports to Monitor Durations
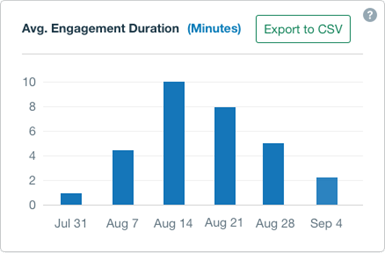
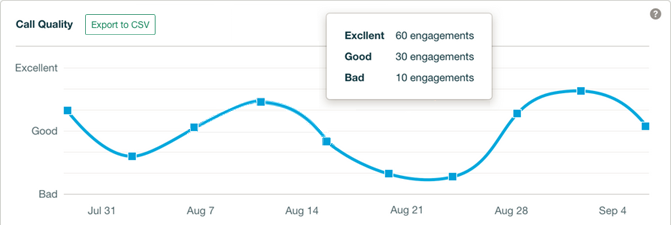
For example, looking at the report above, the spike in average duration in August could be the result of new associates getting acclimated to your system and workflow, or that customers encountered a brand new product bug that your team hadn't any experience in resolving yet. If the average engagement duration is steadily increasing, it could mean that your team is becoming less efficient at handling certain kinds of issues and that your associates need more training. And if the average engagement duration stabilizes or trends down, it could mean that your new associates have acquired the necessary knowledge to fully contribute to your support operations.
Monitoring Individual Performance
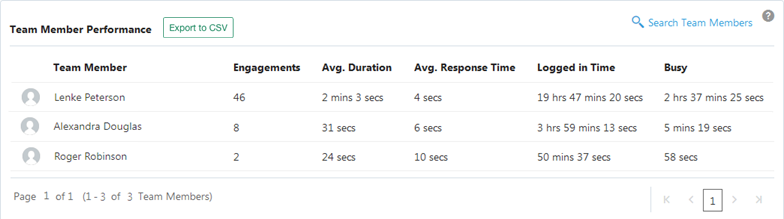
Using the individual associate metrics you can easily identify which associates are performing exceptionally well and who might benefit from further training. You can also search for and select specific associates so that you can compare them side by side.