Viewing App Metrics
The Metrics page enables you to view various data about your app including app installs, app invocations, app service instance creations, record processing time, and batch processing time. For an in-depth look at each metric, see below.
To view app metrics:
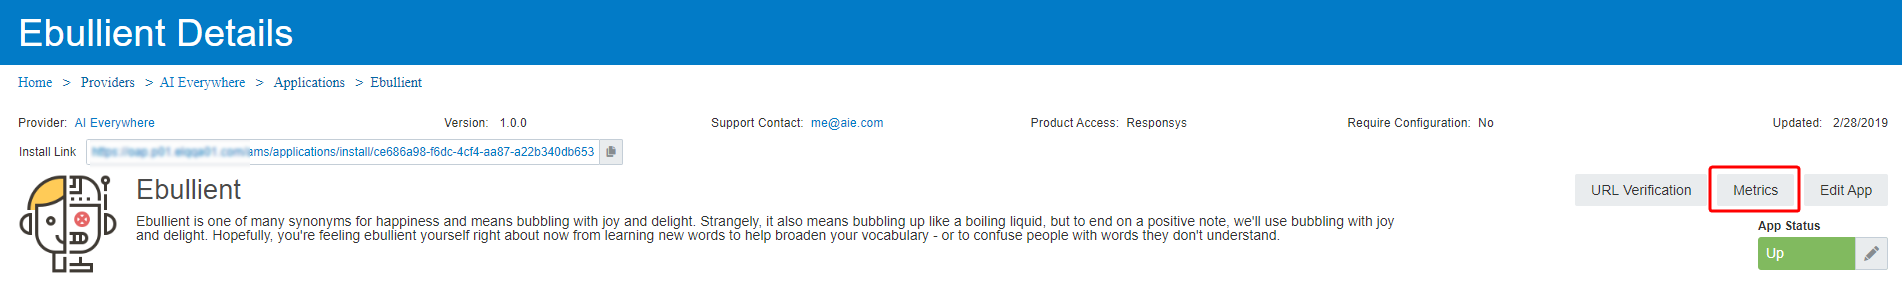
- From the home page, select the app for which you want to view metrics.
-
Click Metrics.
-
Select an app metric:
-
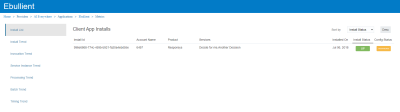
Install List : A list of the accounts who have installed your apps and services, including the install and configuration status. This data is useful for determining where and how often your app is being installed, and whether or not your app is currently installed and configured.
 Click to see the Install List fields.
Field Description Install Id The app installation UUID. This UUID is created when an app is installed. See App Installation to see an example. Account Name The name of the account who installed the app. Product The CX product for which the app was installed. Services The name of the services that were installed with the app. Installed On The app installation date. Install Status The status of the app installation for that user. App Providers can click here to change the Install Status to Maintenance or Up. You'll be asked to provide your app users a reason for the status change, an estimated date and time for resolution, and you can also enter an internal message visible only to other members of your App Provider.
If an app is in Maintenance, all app's installations will also have their status set to Maintenance. The app's status must be Up before app installations can be set to Up.
Config Status The status of the app configuration. Possible statuses are:
- Configured: App is configured correctly by the user and is ready to be used.
- Unconfigured: App has not been configured by the user.
- Error: App has reported failures because of misconfiguration.
- Install Trend: Graphs your app installations over the selected period. This is useful for determining how often your app is installed over a given period.
- Invocation Trend: Graphs the amount of times your app is invoked over the selected period.
- Service Instance Trend: Graphs your app's service instances created over a period of time.
- Processing Trend: Displays the amount of app records that were processed during the selected period. The chart displays the total entities that processed, as well as individually how many records processed successfully and the records that failed. This chart can be useful for determining if there are issues with your app processing.
- Batch Trend: Displays the size of your application's batches over the selected period. The minimum, maximum, and mean of the batches are displayed with the standard deviation provided.
- Timing Trend: Displays the time your app takes to process a batch, separated by minimum, maximum, and average time.
-