Viewing Responsys business metrics
Service Administrators logged in to Oracle Cloud – My Services can view metrics that are useful for administering Responsys service environments. The Business Metrics page shows key metrics for each Oracle Cloud service environment. Business metrics for each product will vary, based on what data is important to show for the product’s users. For Oracle Responsys, these metrics show a summary of service environment-related data for Responsys administrators.
NOTE: The data shown on the Business Metrics page is not the billing data for your organization’s Responsys usage.
You can use this document to:
- Learn about the metrics displayed on the Business Metrics page.
- Access and use the Business Metrics page in Oracle Cloud.
For general information about the Business Metrics page in Oracle Cloud – My Services, see “Monitoring Current and Historical Utilization for a Service” in the Managing and Monitoring Oracle Cloud documentation.
About Responsys Business Metrics
For Oracle Responsys, you can view the following business metrics. The page shows the totals per day, for the date range you select.
- Login Requests: Number of login requests.
- Unique Login Requests: Number of unique login requests.
- Blocked Logins: Number of blocked login requests.
- Successful Connect Jobs: Number of Connect upload jobs that Responsys successfully executed.
- Failed Connect Jobs: Number of Connect upload jobs that Responsys failed to execute.
Notes
The Business Metrics page for Oracle Responsys:
- Shows account-level information that is not available in Interactive Dashboards (the campaign reporting feature in Oracle Responsys).
- Shows data in the UTC time zone.
- Displays data for each active, individual Oracle Responsys account (service environment).
For example, if your company has one account with multiple sub-accounts, then the account and each sub-account is broken out separately. So if you have three cloudified Responsys service environments - rsysbase, rsyssub1, rsyssub2 (one base account and two additional accounts) - then the Business Metrics page displays each service environment’s metrics separately. To view data for rsyssub1, you would select that service environment name. - Displays up to 90 days from the calendar date OR from January 1, 2018 (activation date for Responsys Business Metrics in the Oracle Cloud portal), whichever date is later.
- Is only available in the Oracle Cloud portal. (You cannot view it from Oracle Cloud - My Accounts.)
Access and use the Business Metrics page
To view Business Metrics from Oracle Cloud – My Services:
- Log in to Oracle Cloud.
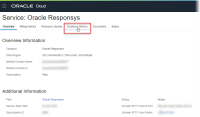
- On the Dashboard page, click the Responsys tile to view the service details.
The Service: Oracle Responsys page is displayed, showing the service overview information.
- Click Business Metrics.
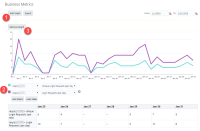
The Business Metrics page is displayed. When you first open the page, it shows data for the past seven days for the service environment and metric selected. The Latest Business Metrics section displays the most recent, available data for the selected service environment.
The following section describes how you can use the controls on the Business Metrics page to view the available data.
Using the Business Metrics page
You can use the controls on the page to customize the data shown. Please note that the page does not retain your settings after you log out.
To change the date range:
Use the From and To fields, located above the graphs, to enter or select a date range. (See item 1 in the example image above.) The maximum date range is 90 days. After you set the date range, the graphs on the page refresh to show the new date range and its data. Note that all graphs on the page will reflect the new date range.
To change the service environment shown in the graph:
Select an environment name from the list below the graph. (See item 2 in the example image above.) The graph changes to show the data for the selected metric, for the selected service environment. If you have only one Responsys account, then there will not be other service environments to select.
To change the metric shown in the graph:
Click the list next to the service environment name, and choose a different metric. (See item 3 in the example image above.) The graph changes to show the data for that metric. If there is no data available for a metric, the metric is not available to be selected.
To show more metrics in a graph:
Click the Add Metric button located below the graph. (See item 4 in the example image above.) A new service environment and metric pair of fields are added to the page. Select the desired service environment and/or metric to be displayed in the graph. You can remove a metric by clicking the remove button ( ![]() ) next to the metric field.
) next to the metric field.
To show a table of data for the last 7 days:
Click the Show Table button below the graph. (See item 5 in the example image above.) The table shows data for the last 7 days of the range show in the graph, for each metric shown in the graph. Click the Hide Table button to remove the table from the page.
To add a graph to the page:
- Click the Add Graph button. The new graph is added above the existing graphs, as shown in the image below.
- Use the controls below the graph to select the desired metrics to show.
- To remove a graph, click the Remove Graph button, which is located above the graph to be removed.
To export Business Metrics:
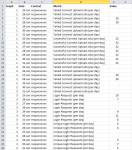
Click the Export button. Cloud Portal downloads a file named usages.csv to your web browser’s default download directory. The download includes all of the business metrics shown at that time on the Business Metrics page. The columns are as follows, and the data is grouped in the following order:
- Graph: Identifies the graph (1, 2, or 3) that displays the data, when there is more than one graph shown on the Business Metrics page.
- Date: For the date range selected, there is a row for each service environment (“Context”) and Metric.
- Context: The Responsys service environment name. This will show the same name, unless you have more than one Responsys account shown on the Business Metrics page.
- Metric: The metric names shown on the Business Metrics page. The file will contain one or more metrics per graph.
- Value: Value for the date for a given Graph + Context + Metric. If there was no activity for that day, the row will not contain a value.
The following example shows data exported from a Business Metrics page that displayed three graphs, for the date range January 25 through January 31, for the Responsys service environments respxxxxxxx. Graph 1 showed the Failed Connect Jobs vs. Successful Connect Jobs. Graph 2 showed the Failed Connect Jobs. Graph 3 showed Login Requests vs. Unique Login Requests. The value column shows the values for the date for the graph, Responsys service environment, and metric. Note that for some days, there was no activity for a given metric, so there is no value present for that row.
If you experience issues using the Business Metrics page in the Oracle Cloud portal, see the Business Metrics issues section in the Troubleshooting FAQ topic.

