Viewing the global report dashboard in a cloud menu
Important: Oracle Sales was formerly known as Oracle Sales Cloud. All instances of Oracle Sales Cloud have been changed to Oracle Sales across the app user interface.
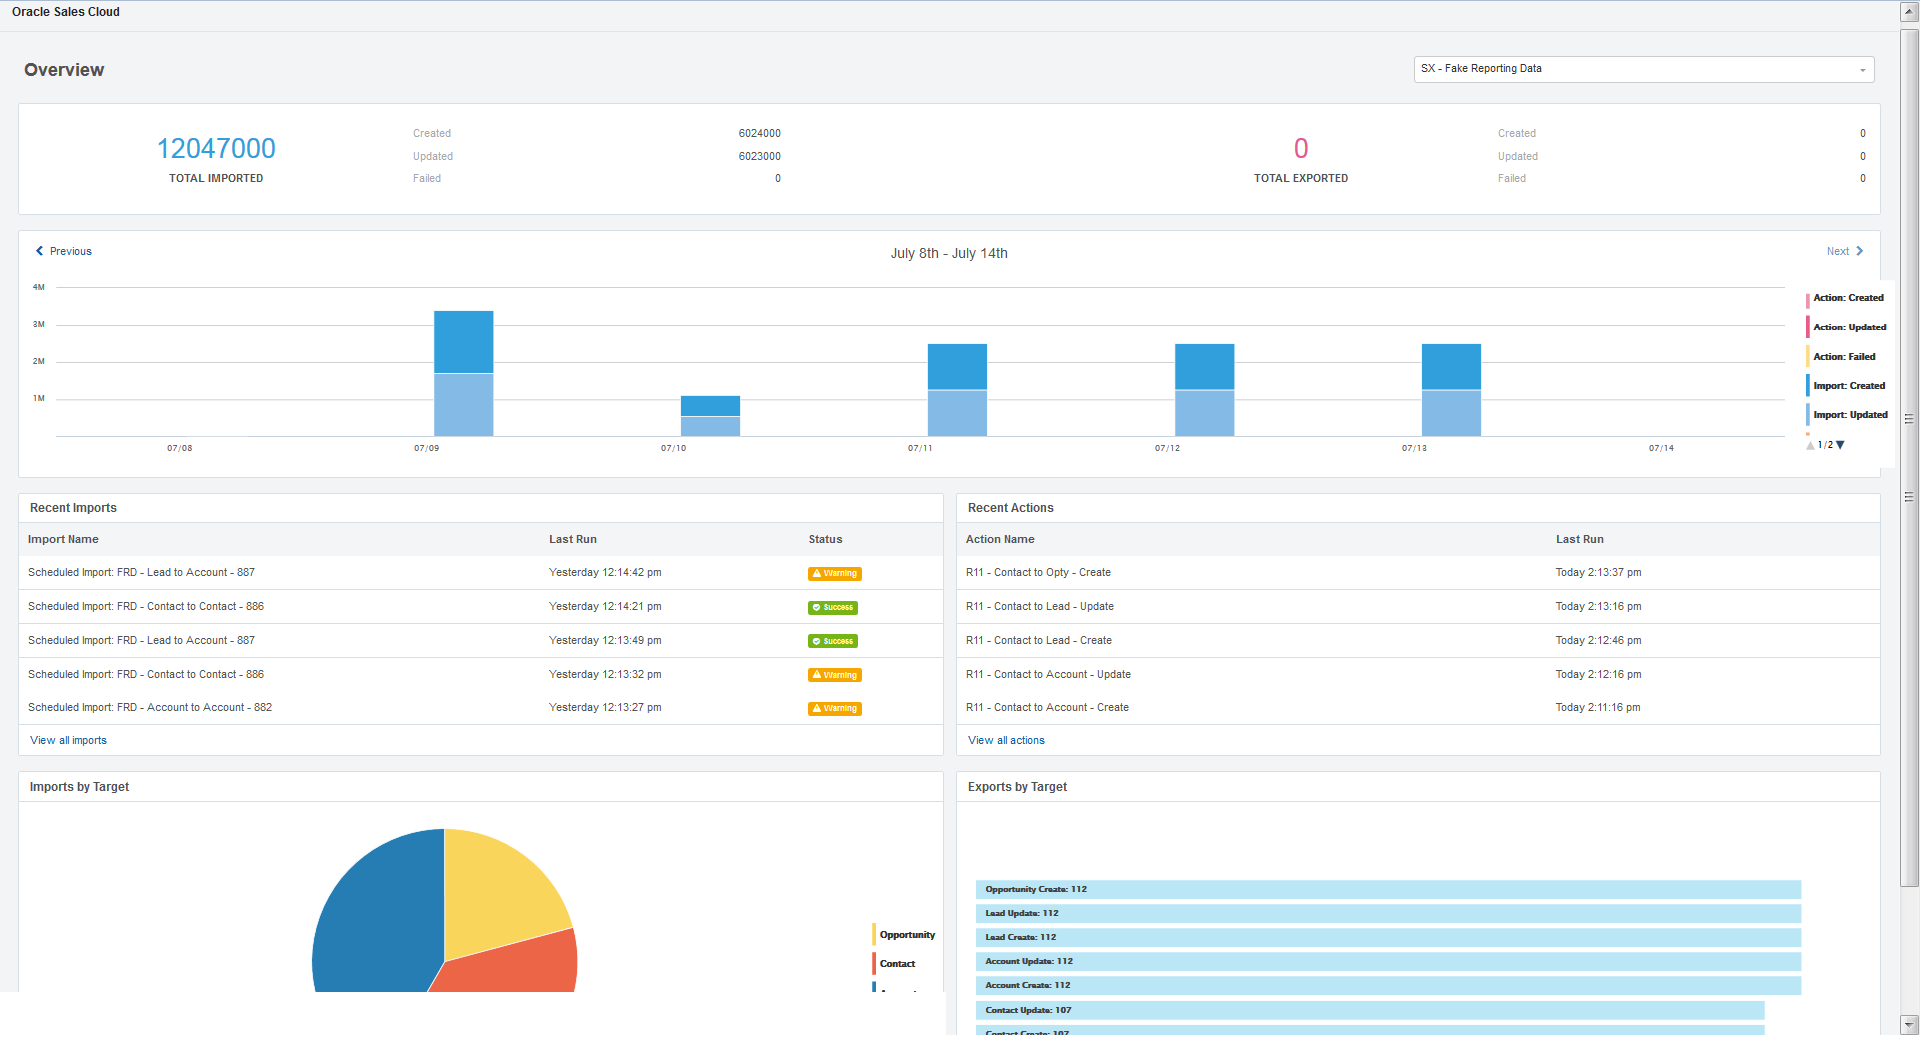
The Oracle CX Sales Integration Reporting Dashboard provides an overview of action and import activity over a span of the last seven days. In this report, the volume of data flowing between Oracle Eloqua and Oracle CX Sales is shown per day, including created, updated, and failed records. The report initially displays the most recent seven days of data, with an option to select a specific seven day period in the past.
The global report dashboard is a cloud menu. Data is retained for a period of 3 months.
To view the global report dashboard:
- In Oracle Eloqua, you can access this report from a cloud menu in a campaign, program, or My Eloqua.
- Click Cloud Content to open the Cloud Content menu, which lists all available content services.
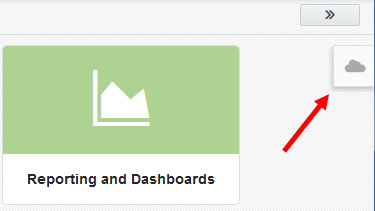
- Locate the Oracle CX Sales Integration Reporting Dashboard, either by scrolling through the list or searching with the search box.
- Click the menu to open the dashboard.
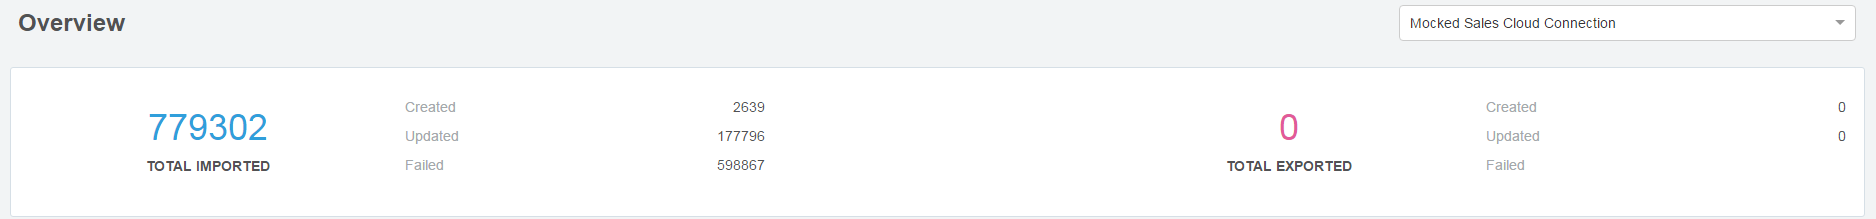
Select a CRM connection for which you want to view a report. An overview of the total amount of imports and exports over the current seven day period that were created, updated, or failed are displayed.
You can view the amount of records created, updated, or failed over a seven day period with an option to view the details for each specific day by mousing over the day. Here, you can view reports for a specific seven day period in the past.

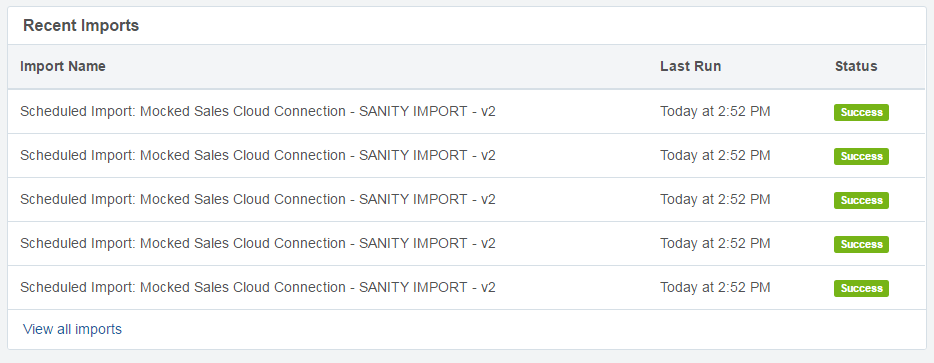
Viewing recent imports and actions
The report also displays recently successful imports and actions and the date and time they were last successful.
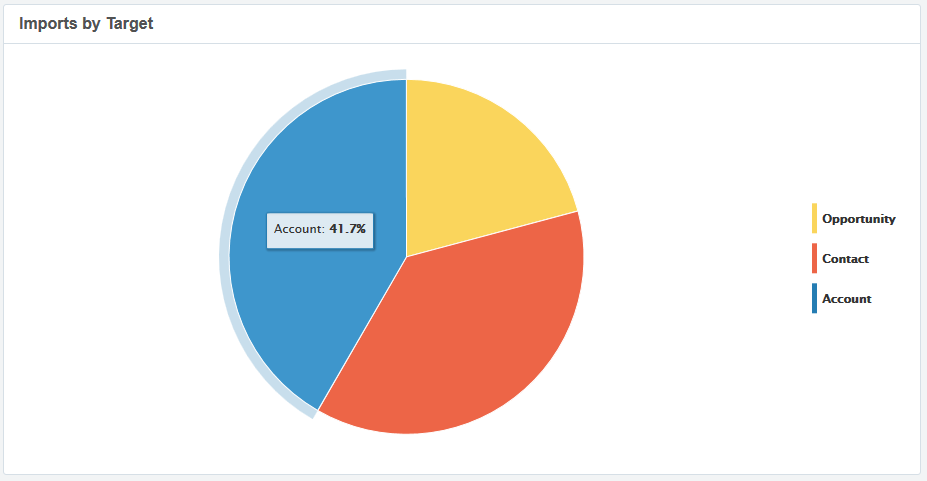
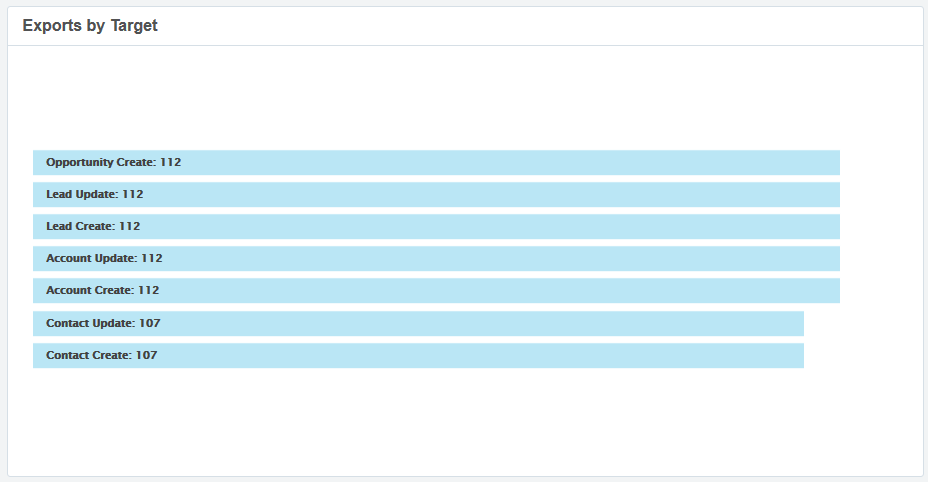
Viewing imports and exports by target
Import data is categorized and displayed in a pie chart to help visually identify how many records are being imported into Oracle Eloqua from Oracle CX Sales by target.
The Exports by Target bar chart displays all records within the period so you can view how many records were created or updated from Oracle Eloqua to Oracle CX Sales, categorized by target.
Viewing report data for actions and imports