Campaign Analysis dashboard
The Campaign Analysis dashboard provides a comprehensive overview of campaign activity and performance for all campaigns grouped by campaign properties, such as type, product, or region. This dashboard uses metrics, such as outbound and inbound activity, as well as response rates, so that you can easily compare the performance of campaigns.
By default, the dashboard shows information for all active campaigns from the last two weeks. You can use the filters to change the date range.
Click a link below to find out more about this dashboard:
Good to know
- The dashboard includes campaigns that were active during the time frame that you specify. The metrics included in the dashboard, however, are not limited to that same time frame. The metrics reflect the activity that happened because of the campaign. For example, you want to view campaign activity as of last month. If a contact opened a campaign's email yesterday and followed a link, the dashboard for last month includes the contact's activity from yesterday. Oracle Eloqua continues to track all campaign activity for 12 months after the campaign end date.
- Campaign responses are recorded only after the campaign's reporting start date. This date might not be the same as the activation date.
- Campaign members could be contacts initially targeted by the campaign, or contacts that performed an inbound activity (for example, a contact that clicked through an email forwarded to them).
- The metrics in this dashboard are calculated at the campaign level for all campaign assets (emails, forms, landing pages, and so on).
- Unless otherwise noted below, forwarded messages count toward the metrics in this dashboard. For example, if a contact forwarded an email, and the recipient clicked a link, the recipient's clickthrough would count towards the clickthrough metrics in this dashboard.
- To access a dashboard report in Insight, click
 . The dashboard reports are available in Insight in the following location: Shared Folders / Dashboard Reports / Campaign Analysis Overview.
Dashboard filters
Use the Filter results section to filter your campaigns. The following filters are available:
- Date Range: The time frame used to determine what campaigns are included on the dashboard. To appear on the dashboard, the campaign must be active during this time frame.
- Campaign Options: Groups the data on the dashboard by Campaign Type, Product, or Region. If a campaign does not have this information, it is classified as Unknown.
Dashboard metrics
| Metric | Description |
|---|---|
| Total Outbound Activity | The amount of outbound activity. Outbound activities include emails sent, emails delivered, and surveys sent. This counts all of the activity including multiple activities by the same campaign member. An outbound activity can be generated by a contact that was initially targeted by the campaign or by a contact that performed an outbound activity (for example, via a forwarded email). |
| Total Inbound Activity | The amount of inbound activity. Inbound activities include email opens, clickthroughs, form submissions, and so on. This counts all of the activity including multiple activities by the same campaign member. An inbound activity can be generated by a contact that was initially targeted by the campaign or by a contact that performed an inbound activity (for example, via a forwarded email). |
| Total Responses | The total response activity for the campaign. Your organization defines what a response is and the priority of the response using response rules. Although a campaign member might respond in many ways to a campaign (for example, clicking through an email or submitting a form), Oracle Eloqua records only the response deemed by your organization as the highest priority response. For example, a form submit at your organization might be considered a higher priority response than an email click-through. So, even if a contact performed both of these responses, Oracle Eloqua records the form submit as a response to the campaign. Responses are captured for a campaign only after the campaign's reporting start date. |
Understanding the charts on the dashboard
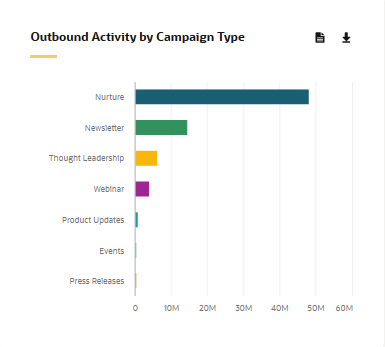
Outbound Activity
This chart shows the total outbound activity (emails sent) for active campaigns within the specified date range. You can use this chart to quickly determine the outbound activity for your campaigns within a given time period.
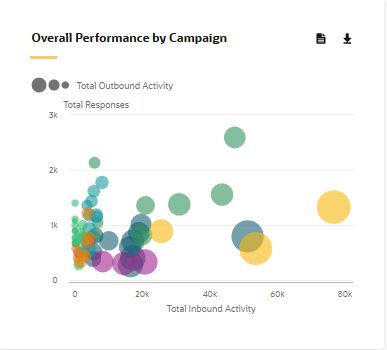
Overall Performance by Campaign
This chart compares the performance of campaigns within a specified time frame, based on the amount of inbound activity (horizontal axis). The size of the bubbles on the chart is proportional to the campaign's outbound activity.
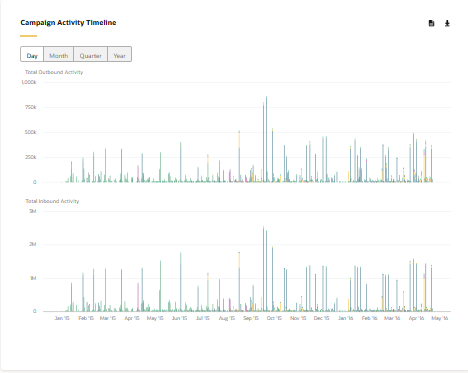
Campaign Activity Timeline
This chart shows the total amount of inbound activity (such as email opens, email clickthroughs, form submissions and website visits) and outbound activity (emails sent).
Since the chart reflects all campaign activity regardless of the time frame you specified for the dashboard, you can use the buttons at the top of the chart to view the daily, monthly, quarterly, or yearly activity.
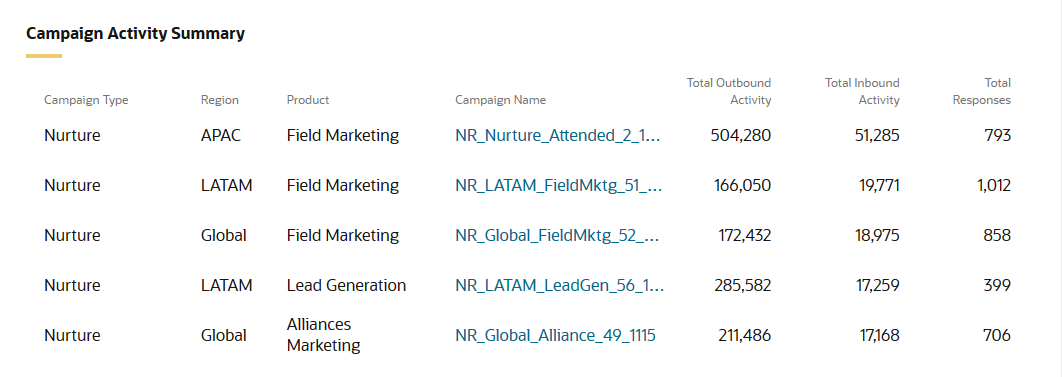
Campaign Activity Summary
This chart shows the inbound and outbound activity by individual campaign. You can click a campaign name to view a detailed dashboard for that campaign. For more information about what is displayed, see Individual campaign performance dashboard.