Website Performance Overview dashboard
The Website Performance Overview dashboard shows information about web page performance and visitors. By default, the dashboard shows web activity from the last two weeks. You can use the filters to change the date range.
Click a link below to find out more about this dashboard:
Good to know
- Below is a breakdown of visitor, visits, page views, and sessions:
- A visitor is someone who visits a tracked website or landing page. A visitor is tracked by the Oracle Eloqua cookie.
- A visit is anytime a visitor viewed your website or landing page.
- A page view is when a tracked web page or landing page on your website is loaded. A visitor might load the same page multiple times which results in multiple page views.
- A session consists of all the visitor's interactions during a given time frame. A session ends when a visitor exits your website, closes their browser, or after 10 minutes of inactivity.
- The data available on the dashboard is updated every hour.
- Oracle Eloqua uses tracking scripts to track visits to your website. After tracking scripts are enabled on your website and a visitor visits a tracked page or clicks a link, Oracle Eloqua places a cookie on the visitor's computer or device. Oracle Eloqua can then capture information about a visit such as how long a visitor spends on a site, the length of the visit, the entry and exit pages, and so on. Additionally the cookie can provide information about the visitor's company, browser, and referring page. See Oracle Eloqua asynchronous tracking scripts for more information.
- To access a dashboard report in Insight, click
 . The dashboard reports are available in Insight in the following location: Shared Folders / Dashboard Reports / Website Performance Overview.
Dashboard filters
Use the Filter results section to filter the website traffic information on the dashboard. The following filters are available:
- Date Range: The time frame of website activity to display on the dashboard.
Dashboard definitions
| Metric | Description |
|---|---|
| Entry Page | The first page of a visit. The base URL (the URL without parameters) is displayed. |
| Exit Page | The last page a visitor views before ending their session. The base URL (the URL without parameters) is displayed. |
| Total Visits | The total visits to a web page. This metric counts one visit for all the page views in the session. A visit is also known as a session. A visit consists of all the visitor's interactions before their session ends. A session ends when a visitor exists your website, closes their browser, or after 10 minutes of inactivity. |
| Contact Visitor vs. Non-Contact Visitor | A contact is a visitor that exists as a contact in your Oracle Eloqua database. |
| Top Location | The visitor location (city or country) based on IP address. |
| Source Type | A source type is a category of which the visit comes from. For example, a search engine or email. |
| Source Name | A source name is a more granular look at the source where the visitor came from. For example, this metric shows the URL or email the visitor arrived from. |
| Total Page Views | The number of times that a page was viewed. A visitor might view the page multiple times during a visit and this metric counts each of those views. One page view is counted every time the page is loaded. |
Understanding the charts on the dashboard
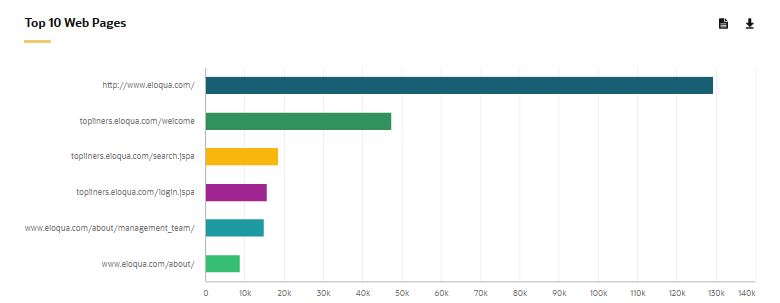
Top 10 Web Pages (by Total Page Views)
This chart shows the top 10 web pages (base URLs) by total page views.
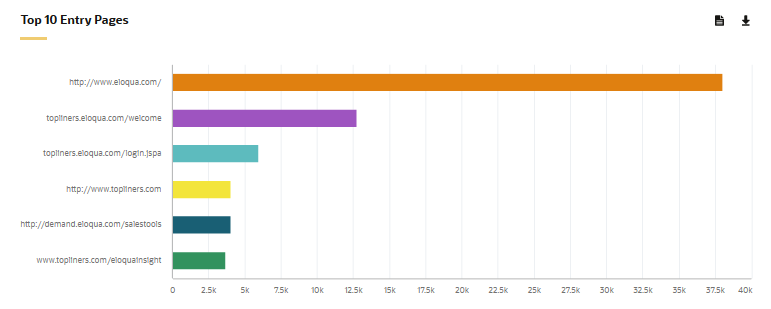
Top 10 Entry Pages (by Total Page Views)
This chart shows the top 10 first web pages (base URLs) by total page views.
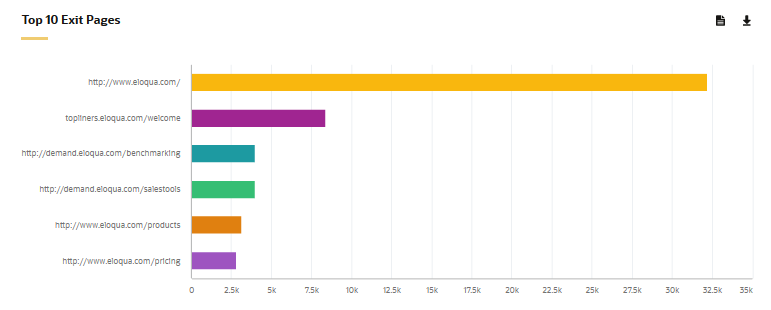
Top 10 Exit Pages (by Total Page Views)
This chart shows the top 10 last viewed web pages (base URLs) of a visit.
Top Locations by City & Country
This chart shows the locations with the most visitors by city or country.

Total Visits by Contact Type
This chart shows the visits by contact and non-contact visitors by day. The totals reflect the state of the visitor (contact or non-contact) as existed on that day. The state of the visitor is not updated due to visitor contact mapping changes (for example, when a visitor becomes a known contact).

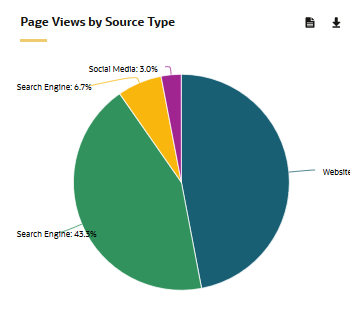
Page Views by Source Type
This chart shows the number of page views by the tracked Source Type. Blank entries are not displayed.
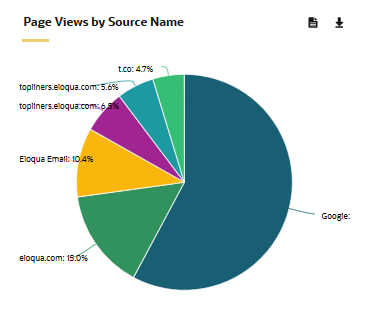
Page View by Source Name
This chart shows the number of page views by the tracked Source Name. Blank entries are not displayed.