Step 2: Adding columns and sections to your dashboard
When we drag our reports to the shared dashboard, Eloqua Insight creates a column and a section for you. You can also drag columns and sections to your dashboard to manage the layout of the dashboard.
- Columns are used to align content on a dashboard. (Sections within columns hold the actual content.) You can create as many columns on a dashboard page as you need.
- Sections are used within columns to hold the content, such as action links, analyses, and so on. You can drag and drop as many sections as you need to a column.
Prerequisites for this step
In order to complete the following step, you must have:
- Completed the tutorial Building your first analysis
- Removed the prompts in the analysis you created in the analysis tutorial
- Added a graph to the analysis you created in the tutorial
Adding columns and sections
To add columns and sections:
- Return to the dashboard you created earlier and click Edit in the center of the page.
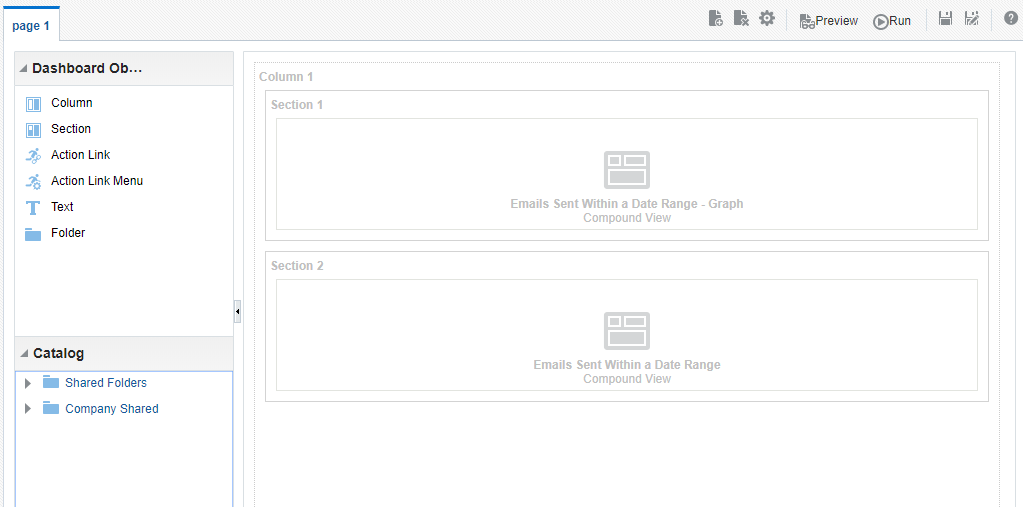
- Drag a column to the dashboard from the Dashboard Objects pane.
This column is labeled Column 1.
- From the Catalog panel, drag the Emails Sent Within a Date Range - Graph analysis to the column. Drag the Emails Sent Within a Date Range tabular analysis to the same column, beneath the Emails Sent Within a Date Range - Graph analysis.
- Save and run your dashboard.