Step 2: Adding columns to the analysis
You can use Insight to build various analysis views, such as table, pivot table, or graphs. In this tutorial, we will use a simple table to display the results of our analysis. We will add columns to the table to show the campaign name, the send date, the email name and subject line, and the total sends.
To add columns to the analysis:
- In the Subject Areas pane, expand Attributes > Campaign. When you do this, you can see various columns available.
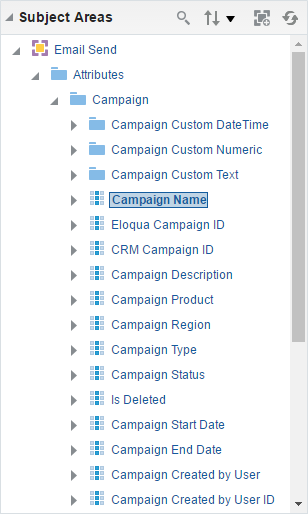
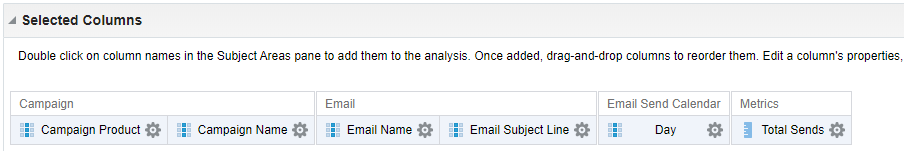
- Drag the Campaign Product and Campaign Name columns to the Select Columns area.
- Expand Email and drag the following columns to the analysis:
- Email Name
- Email Subject Line
- Expand Email Send Calendar and drag Day to the analysis.
- Expand Metrics and drag Total Sends to the analysis.
Learn more about metric definitions.
Our analysis now has all the columns.