Reporting on Personalization
Web personalization content emits a set of analytics event parameters out-of-the-box. Those are:
pers.cmp– web personalization name as in the UIpers.blk– content name as in the UIpers.acn– user’s activity (triggered, displayed, accepted or dismissed)pers.prd– is captured in production (true or false)
Content code can be edited to track any other behavioral data. An example with some guidance on how to do it is provided under the “Custom Code” content template.
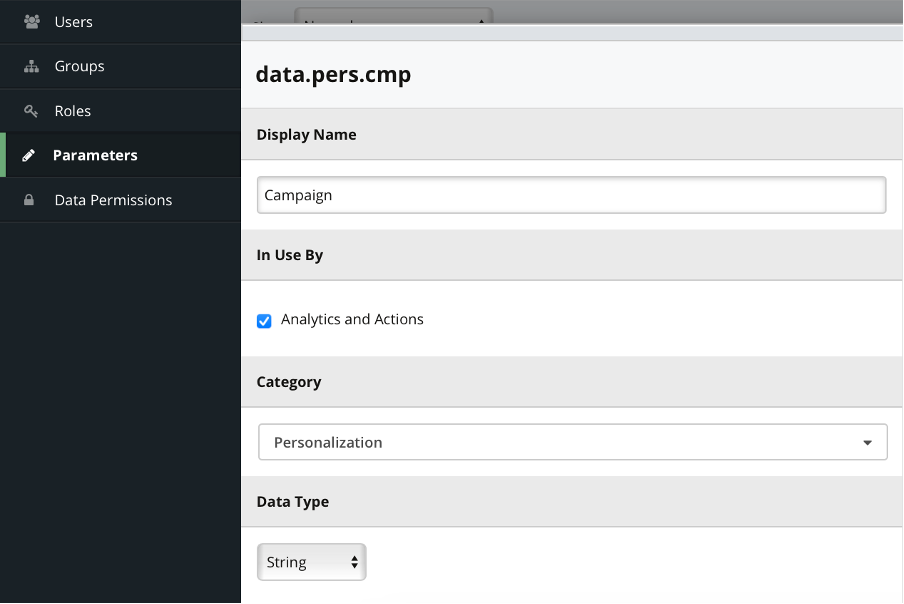
To see the data in the reports, ensure that the parameters that are tracked from the content are named under Settings > Parameters in the Infinity IQ UI. If not, name the parameters yourself. It is important to select the Analytics and Actions checkbox when doing it.
This naming is done once for the whole account. After naming it, you can create a new report in Analytics and follow the three steps below to generate it.
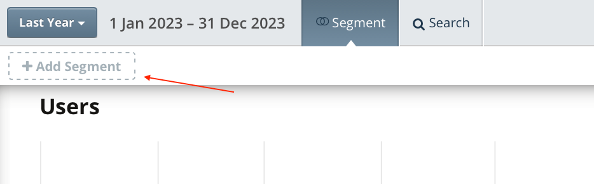
Step 1. Add a segment
Create a segment to show the data specific to a single web personalization. This is done by specifying the web personalization’s name.
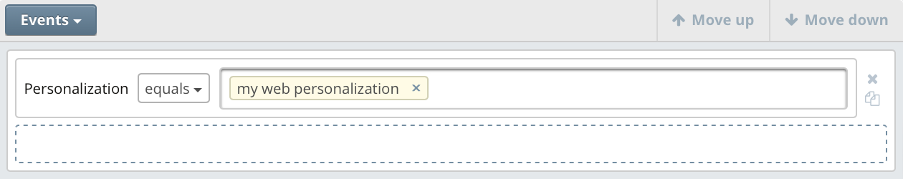
In this example, the pers.cmp event parameter was named Personalization and used to show data for My web personalization only.
Other segments may also be added to specify what data you’re looking for. For instance, a report for the live audiences would have the pers.prd parameter equal to true.
A step-by-step guide on adding a segment is also available at Adding segments to a report
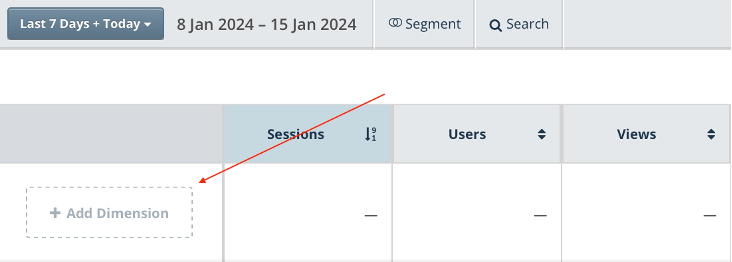
Step 2. Add dimensions
Find the Add Dimension button in the data table.
If the dimensions that correspond to web personalization name, content name and user’s activity are not available, please create those. This should be done once for the whole account.
Add web personalization name as your first dimension and then click the + icon to add content name and user’s activity.
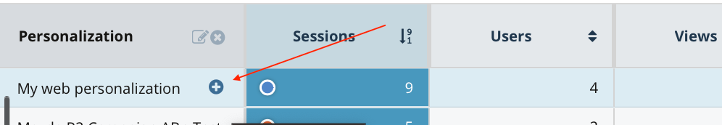
That should generate a report showing the number of sessions, users and views. Number of events can be also added on the table.
There’s more information on adding dimensions at Creating dimensions
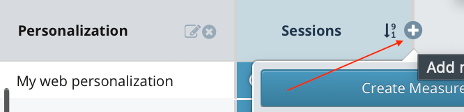
Step 3. Add calculated measures
When adding a measure to the columns, you could calculate it based on a simple formula.
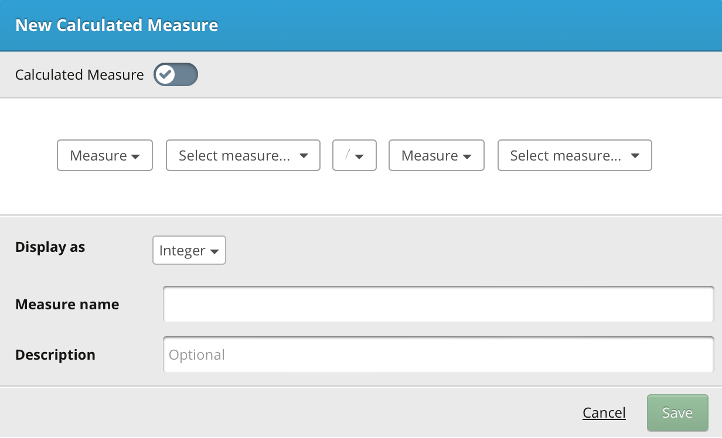
For instance, to calculate conversion, divide the number of users who reached a goal by the number of users who saw the web personalization or a specific content.
A quick summary on calculated measures is available under Calculated measures
Web Personalization Canvas - Learn more on setting up a web personalization