Usage Dashboard
Note: This dashboard is available only to users with the Account Administrator role.
This dashboard provides channel usage reporting to marketers in the form of send volumes for all the channels. With this dashboard, marketers can easily view send volumes in their billing timezone.
Tip: If your account has sub-accounts, you will be able to use the Account prompt at the top of the dashboard.
This dashboard includes the following tables and charts:
- Email send volumes
- SMS send volumes
- Mobile Apps send volumes
- Web Push send volumes
- CX Apps send volumes
To open the Usage dashboard:
- Click
 Insight on the side navigation bar, and select Interactive Dashboards.
 - Click Dashboards > Analytics.
- On the Analytics page, select the Usage tab.
Important considerations
- Usage data does not include the current day’s data. The current day’s data will be available in the next 24 to 48 hours.
- The metrics on these dashboards are displayed in Oracle's billing time zone. The metrics on all interactive dashboards other than this one are displayed in your account's time zone. The precise time zone information is presented just above the Email send volumes chart.
- Users can query data up to the beginning of two calendar years from the current date.
Dimensions
Measures
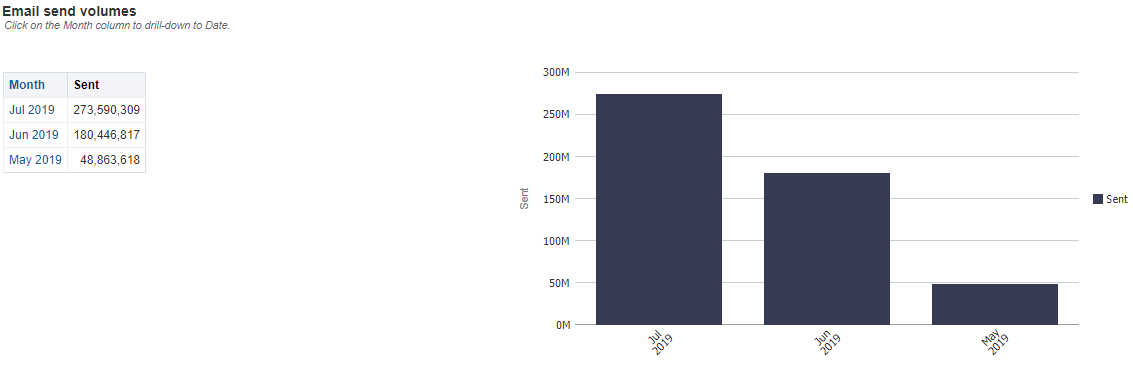
Email send volumes
This section contains a table and a vertical bar chart that display the send volumes for Email by month. The dates in the chart and table are based on the Oracle billing date. You can click on the month in the table, or on a column in the chart, top drill-down to specific dates.
SMS send volumes
This section contains a table and a vertical bar chart that display the send volumes for SMS messages by month. The dates in the chart and table are based on the Oracle billing date. You can click on the month in the table, or on a column in the chart, top drill-down to specific dates. The chart and table also include MMS sent messages.
Note: The SMS send volumes chart and table includes mobile-terminated or mobile-initiated messages for invalid keyword responses, which are not included for all other SMS dashboards.
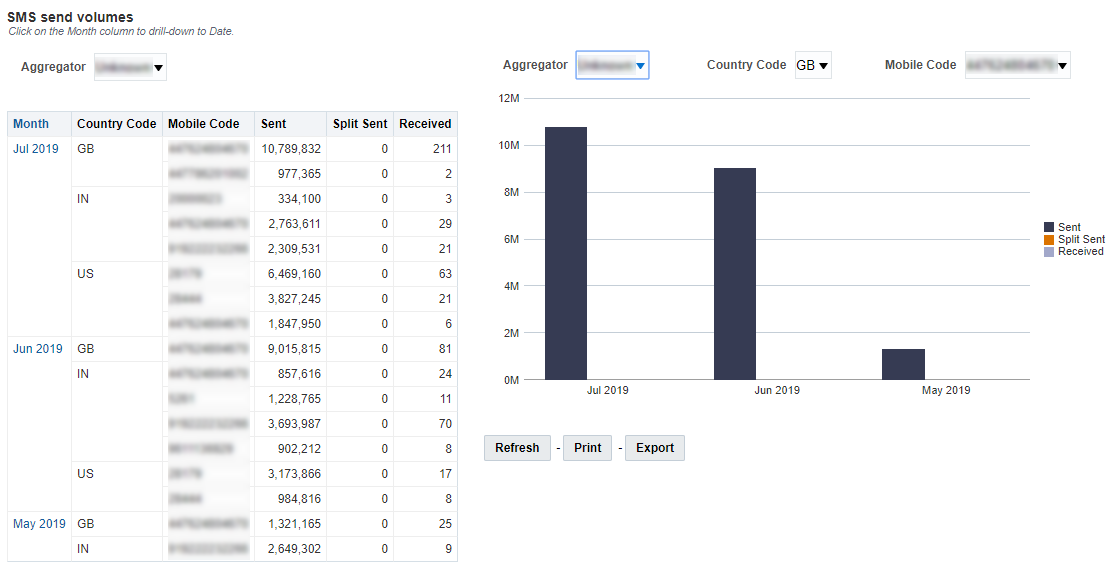
If your account uses SMS Full Service, the dashboard also includes the Full Serve SMS Sent column. This column shows your SMS interaction usage over time. This helps you plan volumes for upcoming campaigns and ensure that SMS usage stays within the quota for your contract.

Mobile Apps send volumes
This section contains a table and a vertical bar chart that display the Mobile Apps send volumes by month, and the send volumes are displayed for In-App, Message Center Direct, and Push. The dates in the chart and table are based on the Oracle billing date. You can click on the month in the table, or on a column in the chart, top drill-down to specific dates.
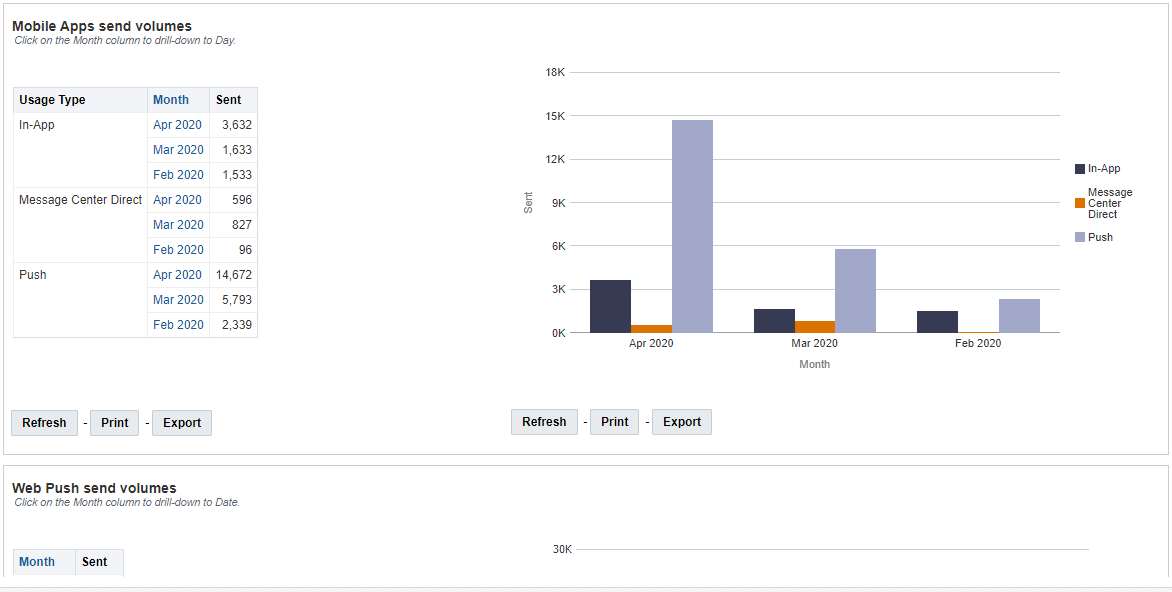
Web Push send volumes
This section contains a table and a vertical bar chart that display the send volumes for Web Push by month. The dates in the chart and table are based on the Oracle billing date. You can click on the month in the table, or on a column in the chart, top drill-down to specific dates.

CX Apps send volumes
Note: The reports display only the apps that can be used in Responsys programs.
This section contains a table and a vertical bar chart that display the send volumes for CX Apps by month. The dates in the chart and table are based on the Oracle billing date. You can click on the month in the table, or on a column in the chart, top drill-down to specific dates.
This report allows marketers to view send volumes for a particular app ( for example, Whatsapp) for a particular timeframe. Data is available at the app level. The CX Apps send Volumes dashboard is updated daily. While the Default Date Range is set to 3 months in the past, this can be changed by the user to lookback as far as data is available.
