Quality Specification Collapsible Panes
The quality specification is organized by the following collapsible panes:
Specification Queue
The Quality Specification Queue window shows icons that direct you to Quality Tablet Collections features.
To control the table contents and identify inspection activities to be taken, click the specification queue to search, filter, and then adjust your tablet language settings.
Tablet Sidebar
The Quality Management tablet's collapsible sidebar shows the same list of Pending and In-Work inspections as the main Inspection Queue page.
To Expand the sidebar, tap the menu icon ( ).
).
To Collapse the sidebar, tap the close icon ( ).
).
Collapsible Pane
Quality Management lets you collapse the upper information pane to maximize screen space for data entry.
To Expand the information pane, tap the down arrow ( ).
).
To Collapse the information pane, tap the up arrow ( ).
).
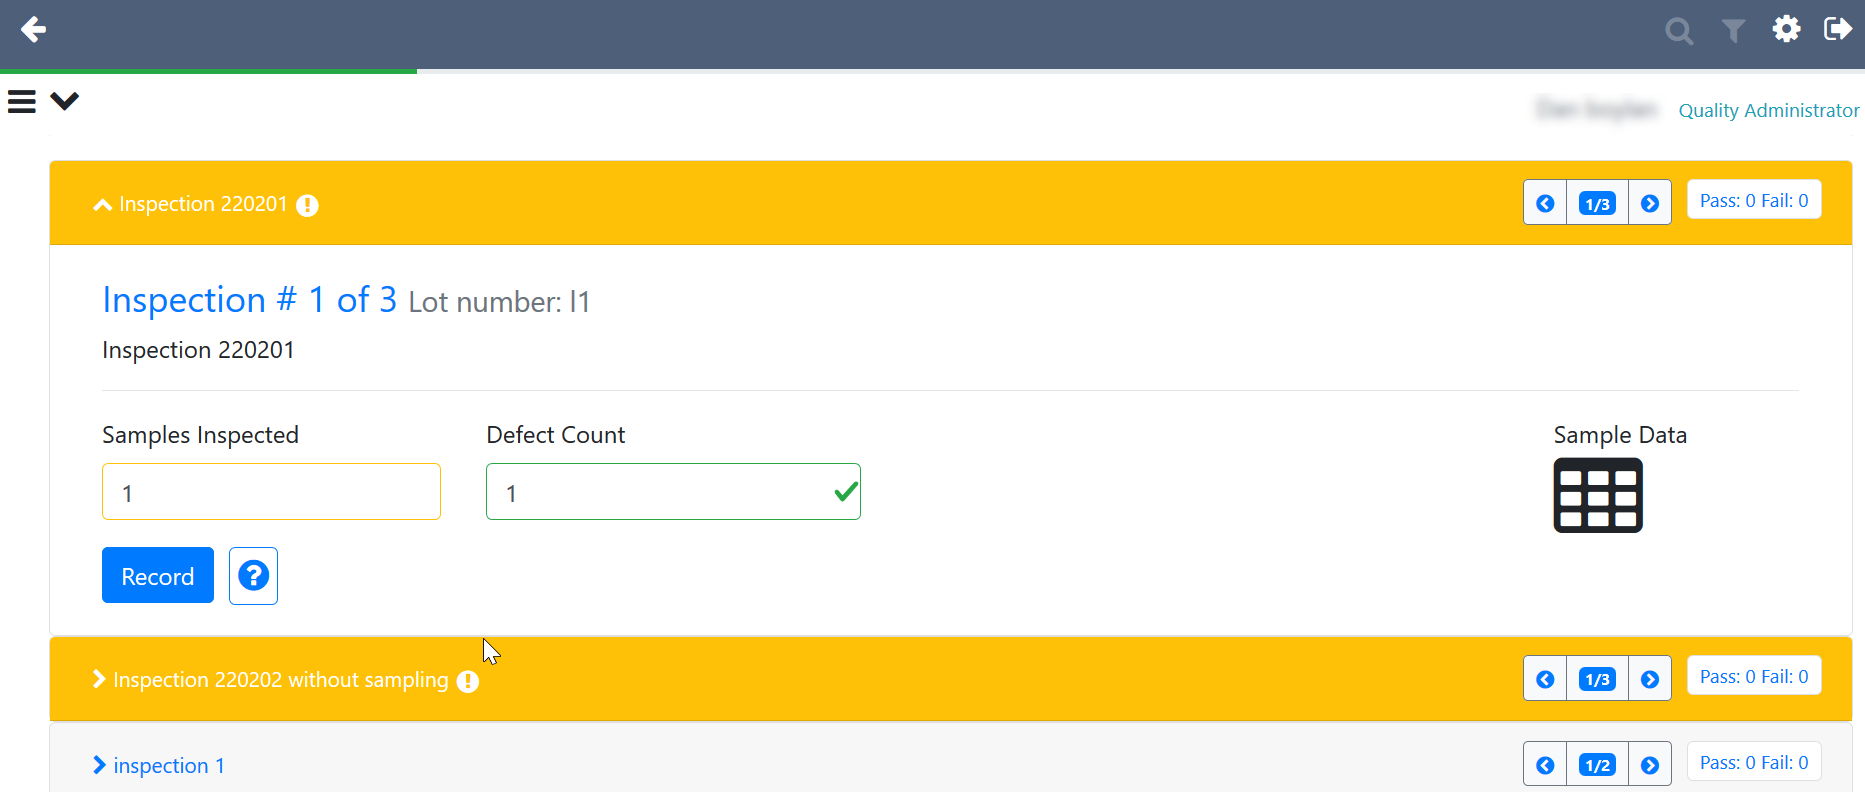
The following screenshot shows a typical quality inspection:
The following table describes the Tablet Data Entry window details:
|
Field |
Description |
|---|---|
|
Inspection Bar |
A vertical list of inspections to be performed. These panes are presented top-to-bottom based on the sequence number assigned to them during setup. The color of the pane highlights the inspection activity:
The collapsible inspection bar displays the inspection number (220201), the number of inspections to be conducted, and the number of pass or fail inspections. |
|
Inspection Panes |
Displays the inspection details. In this example, the number of inspections to be conducted (1 of 3), any lots associated with this inspection, and inspection number. |
|
Inspection Instructions |
Detailed information that describes the inspection procedure or expected outcomes. This example displays, 'Review material certificate. File with vendor.' |
|
Summary Data |
Summary data displays as data fields for non-sampling inspections. Layout is controlled by inspection setup. This enables you to enter data to drive inspection pass or fail behavior. Sample data is supporting data and is set up automatically. |
|
Sample Data Grid Icon |
The sample data grid icon ( To display the sample data grid, click the sample data icon. |
|
Sample Data Grid |
|
|
Record |
To save the data entered, click Record. |
|
? (Inspection Help) |
To display a description of the inspection specification, click the help icon. This displays details such as minimum and maximum measurements and instruments required. In this example, Material Certificate is OK. |
|
Finish Inspection |
To complete the inspection, click Finish inspection. If a required inspection is not complete, the Finish inspection button is hidden. |
|
Evaluate Sample Data |
To evaluate inspected sample data and automatically populate the values in the sampling summary fields, click Evaluate Sample Data. |
 ) appears when sample data collection is enabled.
Inspection Queue Fields Details
The tablet inspection details table displays summary information for all specifications that are in Pending or In Work status. You can report data for a Location, Specification, Transaction, Item, and Status you want to report data for.
Click the arrow beside the column name to sort all queue data based on values in that column. The active sort column title is highlighted blue.
The following table describes the inspection queue fields.
|
Field |
Description |
|---|---|
|
Location |
The name of the facility where the inspection is to be performed. |
|
Specification |
The specification ID number. |
|
Item Description |
A brief description of the item. |
|
Transaction |
The NetSuite transaction, Item Receipt, Work Order Build, or Work Order Completion, that matches a specification context. In this example, Purchase Order #61 initiates the inspection. |
|
Quantity |
The number of items to be inspected. |
|
Transaction Date |
The time that has elapsed since the inspection was queued. |
|
Priority |
The urgency of the inspection relative to other inspections. |
|
Assignee |
The name of the quality engineer the inspection is assigned to. |
Related Topics
- Searching for a Quality Inspection
- Filtering a Quality Specification Queue
- Quality Specifications in the Quality Management Tablet Interface
- Set Up the Quality Management Tablet Interface
- Quality Management Tablet Data Collection
- Quality Inspection Sampling for CSV
- Quality Management Mobile Data Collection
- Quality Management Overview