Creating a Manufacturing Workbook
The following procedure provides details for creating a manufacturing workbook.
To create a manufacturing workbook:
-
Enable SuiteAnaytics Workbook.
For more information, see Enabling SuiteAnalytics Workbook in Your NetSuite Account.
-
Select a workbook root record:
-
Click the Analytics tab.
-
Click New Workbook.
-
In the Search Record Types field, enter Manufacturing.
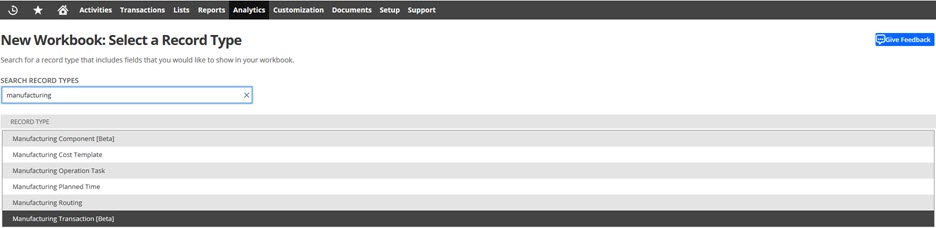
-
Click the Manufacturing Transaction [Beta] record.
The Data tab opens with preselected fields on the Data Grid based on the manufacturing record.
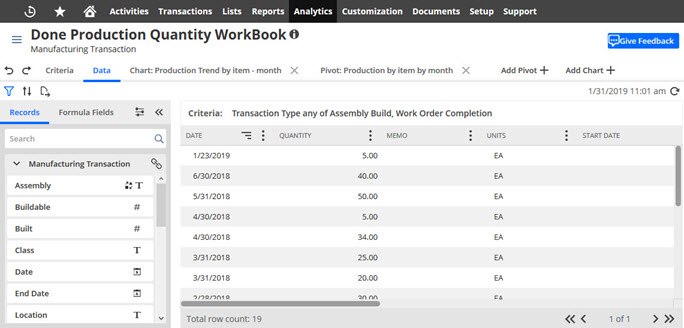
You can use only those fields that you add to the Data Grid to generate a pivot table or chart. By default, the Data Grid displays preselected fields, based on the root record selected for the workbook.
-
-
To select source data, use one of the following options to add fields from the Manufacturing Transaction record root to the data grid:
-
From the Manufacturing Transaction record, drag a field to the Data Grid
-
Double-click a field
-
In the Search field, enter the field name and then drag or double-click the field
-
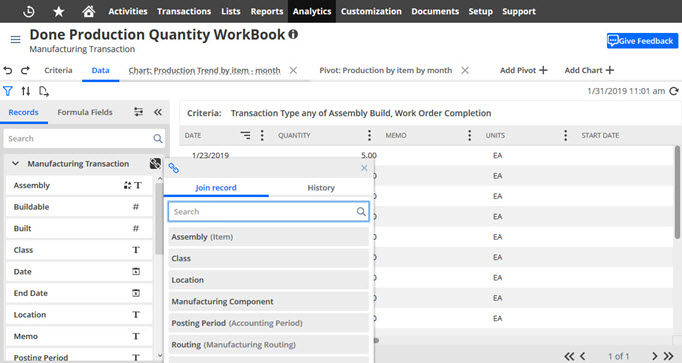
To add fields to the data grid from the Manufacturing Transaction related record, click the Join Record icon (
 ).
).
-
Select a Join record.
The Fields list updates to include the related record fields. Double-click or drag fields to the data grid.
-
-
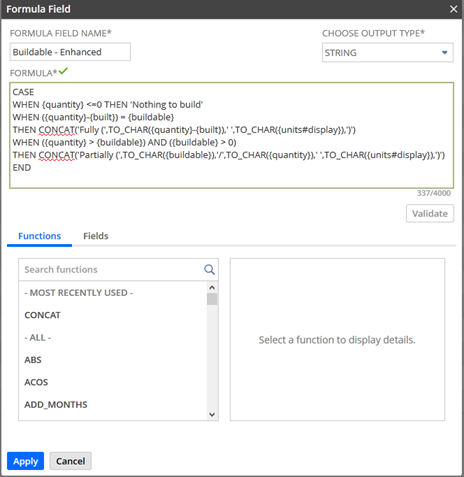
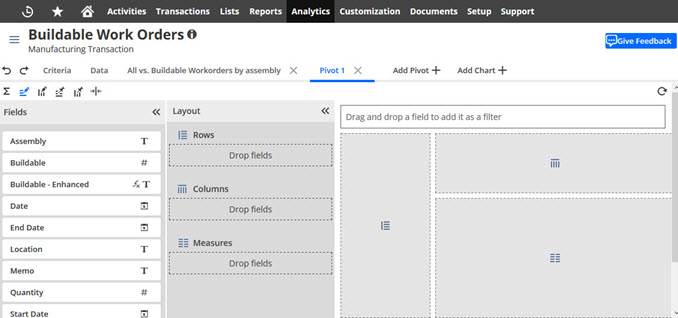
To create formula fields, click the Formula Fields tab.
-
Enter the Formula Field Name.
For example, Buildable - Enhanced.
-
Select an Output Type.
For example, String.
-
In the Formula field, enter the field IDs and SQL formula functions to use in the formula expression.
Alternatively, in the Functions and Fields sections, double-click the field IDs or formula functions to add them to the expression.
-
Click Validate.
-
If there are no errors, click Apply to add the formula field to the workbook.
-
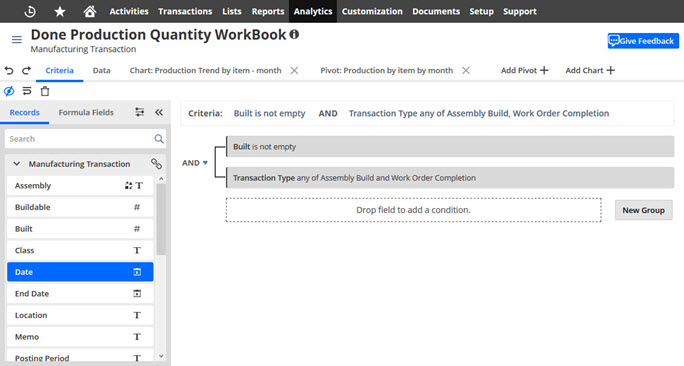
To filter the data source, click the Criteria tab.
-
Drag a record or formula field.
-
In the Filter window, select the filter conditions to apply to the field.
-
Repeat these steps for each filter you want to define.
By default, filters are added using an AND operator. To change the relationship between filters and filter groups, click the AND link and select OR from the popup window.
-
Click OK.
-
When you finish defining filters, click the Data tab.
The Data Grid displays only values that match your selected filter conditions, and a Criteria Summary appears above the grid.
-
-
To create a pivot table, click Add Pivot.
Drag fields into the Rows, Columns, or Values section in the Layout panel.
For example, the Assembly row, Date (Year) and Date (Month) columns, and Quantity (Sum) measure.
-
Select the summary type and format options for any date or numerical fields.
-
Beside the next to the field you want to format, click the Field Menu icon (
 ).
). -
Select Summary Types.
-
-
Add totals and grand totals to the pivot table:
-
In the menu bar, click the totaling icon (
 ).
). -
In the Totaling window, for each field, select where you want the totals or grand totals to appear.
-
Check the Set Individually box to select where the totals for each field will appear on the pivot table.
-
Click OK.
-
-
Click Refresh (
 ) to generate the pivot table.
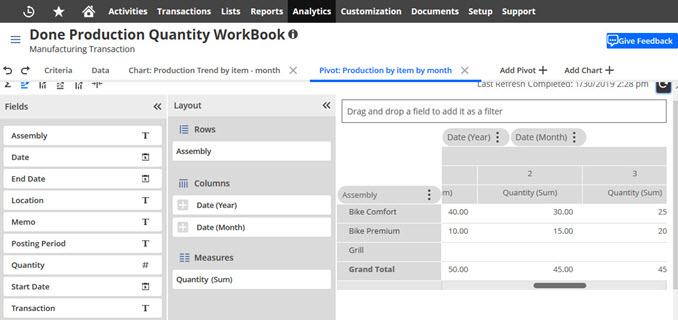
-
-
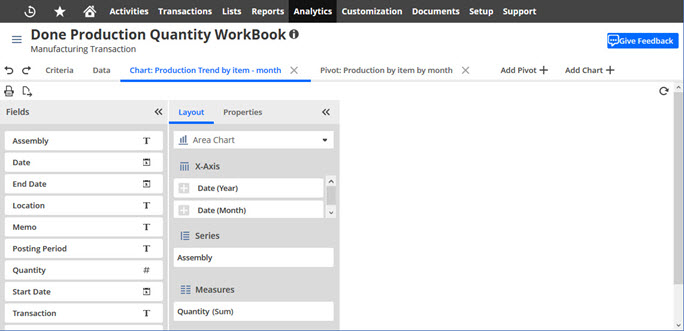
To create a chart, click Add Chart.
-
Drag fields into the X-Axis, Series, or Measure section in the Layout panel.
For example, create an Area Chart, with Date (Year) and Date (Month) on the X-Axis, for the Assembly Series, with Quantity (Sum) Measures.
-
Select the summary type and format options for any date or numerical fields.
-
Beside the next to the field you want to format, click the Field Menu icon (
). -
Select Summary Types.
-
-
In the Layout panel select a chart type.
-
Click Refresh (
) to generate the chart. -
In the Workbook Menu (
), click Save As. -
In the Save Workbook As window, enter a name and description for the workbook.
-
Click Apply.
-