Optimizing Server-Side Actions
You can achieve optimal product performance by consolidating server-side actions. If you combine multiple tasks into a single, larger server-side action, server requests are reduced and performance improved. An optimized product typically launches a minimum number of server-side action requests-ideally one-for each user action, such as a click or data entry.
This approach helps prevent server response delays caused by multiple requests for a single action. For examples of optimized server-side actions, see Code Examples. For more information about verifying server-side actions performance, see Verifying Server-Side Actions Performance.
Another way to optimize server-side actions is to apply the lightweight mode, which only loads product data when required. This mode enhances performance for non-optimized server-side actions that don't interact with product data. Examples of functions that require product data are setAnswer(), getTable(), and getQTable().
When applying the lightweight mode, use the scratchpad variable to transfer data from the server to the client. Avoid using questions and answers, qTables, and function-generated tables for this purpose. Additionally, excluding functions that load product data can further improve server-side action performance. Whenever possible, it's best to use these functions in client-side actions to optimize performance.
The list of functions that load product data-even in lightweight mode-includes:
-
createTable()
-
getAnswerDesc()
-
getAnswerLabel()
-
getAnswerName()
-
getAnswerVariable()
-
getQTable()
-
getTable()
-
reset()
-
setAnswer()
-
setValue()
-
updateTable()
To enable the lightweight mode:
-
Go to CPQ > Configurator > Settings.
-
Check the Enable lightweight mode box.
-
Click Save.
Verifying Server-Side Actions Performance
You can verify the performance of server-side actions by launching a product and appending the "&debug=T" string to the product URL. Then, open the console and analyze the detailed logs for each server-side action. The following image shows an example of logs that can help you identify potential performance issues.
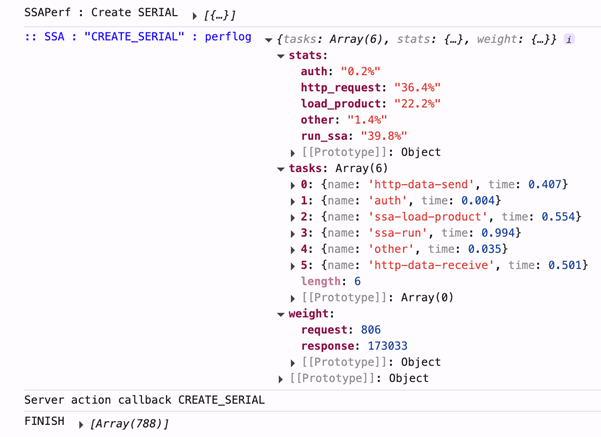
In the tasks section of the logs, you can view performance metrics (in seconds) for each server-side action:
-
auth - Shows the time spent on authentication when a server-side action is initiated. The server must verify a user's authorization before allowing access to server-side functions.
A high value may indicate that a large amount of data (megabytes) is being sent. Consolidate server-side actions for large data transfers into a single server-side action to ensure a faster authentication and improve performance.
-
http-data-send and http-data-receive - Show the time required to send data to and from the server. High values usually indicate that temporary data isn't being cleared when you send requests to the server. To optimize performance, remove large amounts of data from the scratchpad variable and answers after use.
-
ssa-load-product - Indicates the time required for loading a product. If this key is present, the product has been loaded. If the product shouldn't be loaded, remove functions that load it from the server-side action.
-
other - Corresponds to the time required to perform internal tasks related to the request and prepare the response for the client. A high value may indicate performance issues.
Alternatively, you can view the same metrics as percentages in the stats section. The http-data-send and http-data-receive keys are combined under the http_request key.