Forecasting with sales subcategories
The forecasting screen is split into 3 widgets (2 on top, one underneath):
-
View
-
Basic
-
Graph/Advanced
View
Changing the options here will change the week and location you are forecasting for. Move between locations you manage as well as forward through the future. You can also create forecasts ahead of time.
Basic
Basic forecasting information to help you get started.
Select a week in the past that you want to forecast sales to. If you have setup a default fetch period, it'll automatically show fetch period (and pre-load it if all the data is available).
This is a week in the past which you think may have similar sales due to factors such as events, weather, or promotions. After it has been selected, you can add a rolling average or change the index percentage (ie. if you expect the forecast for the week to be a 2% increase from the period you selected, type '2')
Graph/advanced
Comparative graphs show you the sales & units that you have forecasted for each day of the week ahead. This helps with visualizing which days of the week will have the busiest demand.
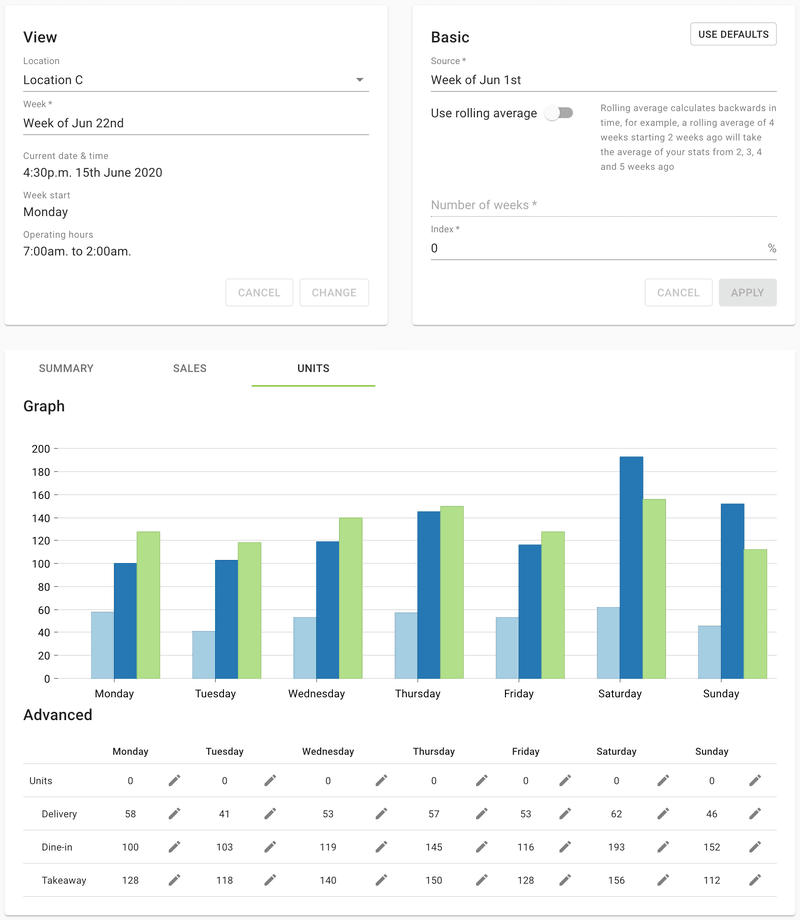
The "Summary" lets you edit the sales or units for each day that week by clicking the pencil icon next to the day & stats type. You'll get a popup box similar to the "Basic" widget - this lets you change that day/stats type you've selected - this won't affect the rest of your forecast. For example, you may want to edit only a public holiday as you're expecting increased demand.
Selecting "Sales" or "Units" at the top of the widget lets you edit the values for different sale subtypes - for example if you're expecting increased takeaway & drive-thru orders.