Forecasting
Why should I do this?
Having an accurate weekly sales forecast will let you:
-
Meet your expected sales demands
-
Optimize sales growth both during and off-peak
-
Display KPIs to deploy labor that meets the business needs
How does Workforce Management help with this?
Workforce Management has user workflows to help you from start to finish with planning your labor deployment, starting with building your sales forecast.
Workforce Management has the ability to:
-
Forecast sales taking a rolling average for multiple weeks
-
View forecast by day part and hours
-
Edit forecast by day, day-part and hours
Set Up
Top level users can set "default stats" for their entire organization or a group of locations by going through the Setup > Brands menu.
Defaults can be created for the following additional items within a brand:
-
Schedule start day
-
Shift intervals
-
Break lengths
-
Break required after X Hours
In this screen, you can set defaults for Sales forecasting that apply to all locations within this brand.
Two you'll have when selecting a period for the default stats are:
-
52 weeks ago (last year's actual sales)
-
2-4 weeks ago (current sales pattern)
Use rolling average, on or off?
-
This option when turned on uses multiple weeks to average the hourly POS KPIs. This removes abnormalities in a single day's POS data.
-
Rolling average calculates backwards in time, for example, a rolling average of 4 weeks starting 2 weeks ago will take the average of your stats from 2, 3, 4 and 5 weeks ago.
Apply an index of?
Applying an index should be used to apply your current sales comp when using POS data from last year.
-
To apply a sales comp of 15%, you would enter an index of 15
-
To apply a sales comp of -10% you would enter and index of -10
Additionally, you can set individual default stats for their locations by going through Setup > Locations.
Generating the forecast
Generating an accurate sales forecast is the first step in creating a weekly schedule that meets the expected volume demand, grows sales, and provides business outcomes. You have three options to create a sales forecast.
POS defaults
Selecting this option uses the locations default settings. Setting up default settings is explained under Set Up. If you don't have access to set this up, your manager or Franchisee will.
This option uses historical POS hourly sales data and has the flexibility to let you to use a rolling average and apply an index (Multiplier or Sales Comp) to the selected data.
Use custom POS settings
This option is the equivalent of use POS defaults; however it lets you override the locations defaults and use POS data relevant for an individual week.
Understanding the sales forecast screen
When your sales have been generated, the "view forecast" screen displays total week by day, representing the current forecasted Sales and transactions by day of the week. Sales are the blue bar using the left axis. Units are the red bars using the right axis.
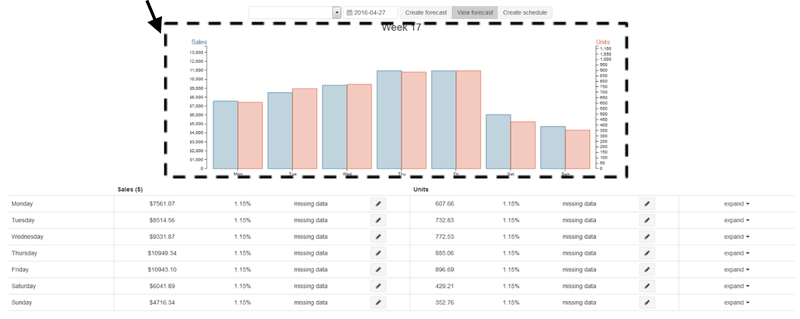
Above also shows the daily break down of Sales and transactions used, index applied, and type of POS data used. Pencils available at the end of each row can edit an individual day's forecast, and the expand section will direct you to another graph which shows the day part and hourly sales for that day.
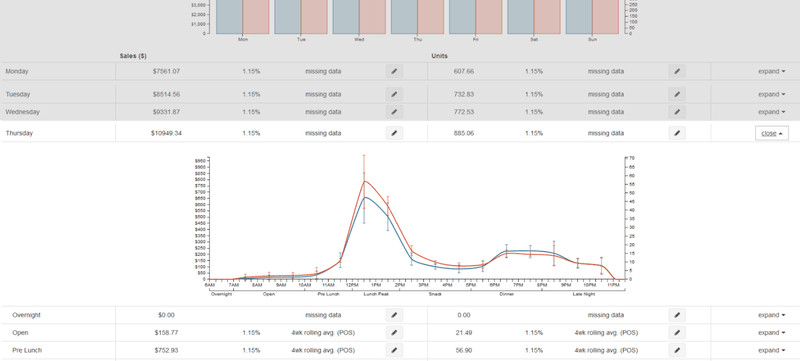
Day part and hourly forecasting
By clicking 'expand' on the right of any individual day, you can now see the day part and hourly breakdown of the sales forecast. This is represented by both a graph and summary of the actual projection; the graph details both the Sales (Blue line) and Units (Red Line). The graph also uses vertical exponential data bars to highlight the variance in the data set used for the forecasted hour.
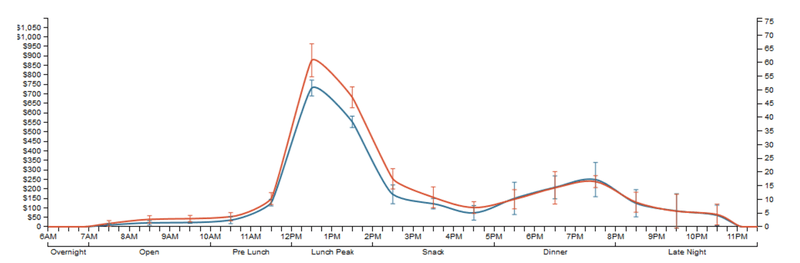
Large bars represent a large fluctuating data set; low bars represent a consistent data set.
In the below example the lunch 12-1pm period is showing a large vertical bar, this means that the rolling average data used for that hour wasn't consistent and might have a week included that's causing an abnormality in the data, this could be because a day was unusually busy, or unusually quiet.
Hours with a large vertical bar should be checked for accuracy in the forecast. Within this screen, you can edit an individual day part or particular time of day. This targeted approach to sales forecasting lets you accurately deploy labor at the appropriate times.