Introduction to Chrome DevTools for SuiteScript 2.1 Script Debugging
The 2.1 Script Debugger offers a subset of the full Chrome DevTools features found in Chrome.
Only SuiteScript 2.1 scripts can be debugged using the 2.1 Script Debugger. You cannot use the 2.1 Script Debugger to debug SuiteScript 1.0 or 2.0 scripts.
Some of the following information, provided as a summary of the Chrome DevTools as it can be used in debugging JavaScript, is from Chrome DevTools. Refer to that site for complete information.
Also refer to Debug JavaScript and JavaScript Reference for additional help specific to debugging JavaScript code.
Chrome DevTools is a set of web developer tools built directly into the Google Chrome browser. Chrome DevTools can help you edit pages on the fly and diagnose problems quickly. The JavaScript section of the Chrome DevTools site (JavaScript) has tutorials and videos showing you how to debug your JavaScript code. Most of these are included in the 2.1 Script Debugger. Se 2.1 Script Debugger Overview for a list of capabilities provided in the 2.1 Script Debugger.
Use CTRL+SHIFT+I to access Chrome DevTools from within the Chrome browser. Note that you do not have to do this when debugging SuiteScript2.1 scripts because NetSuite automatically provides the Chrome DevTools capability in a separate browser tab.
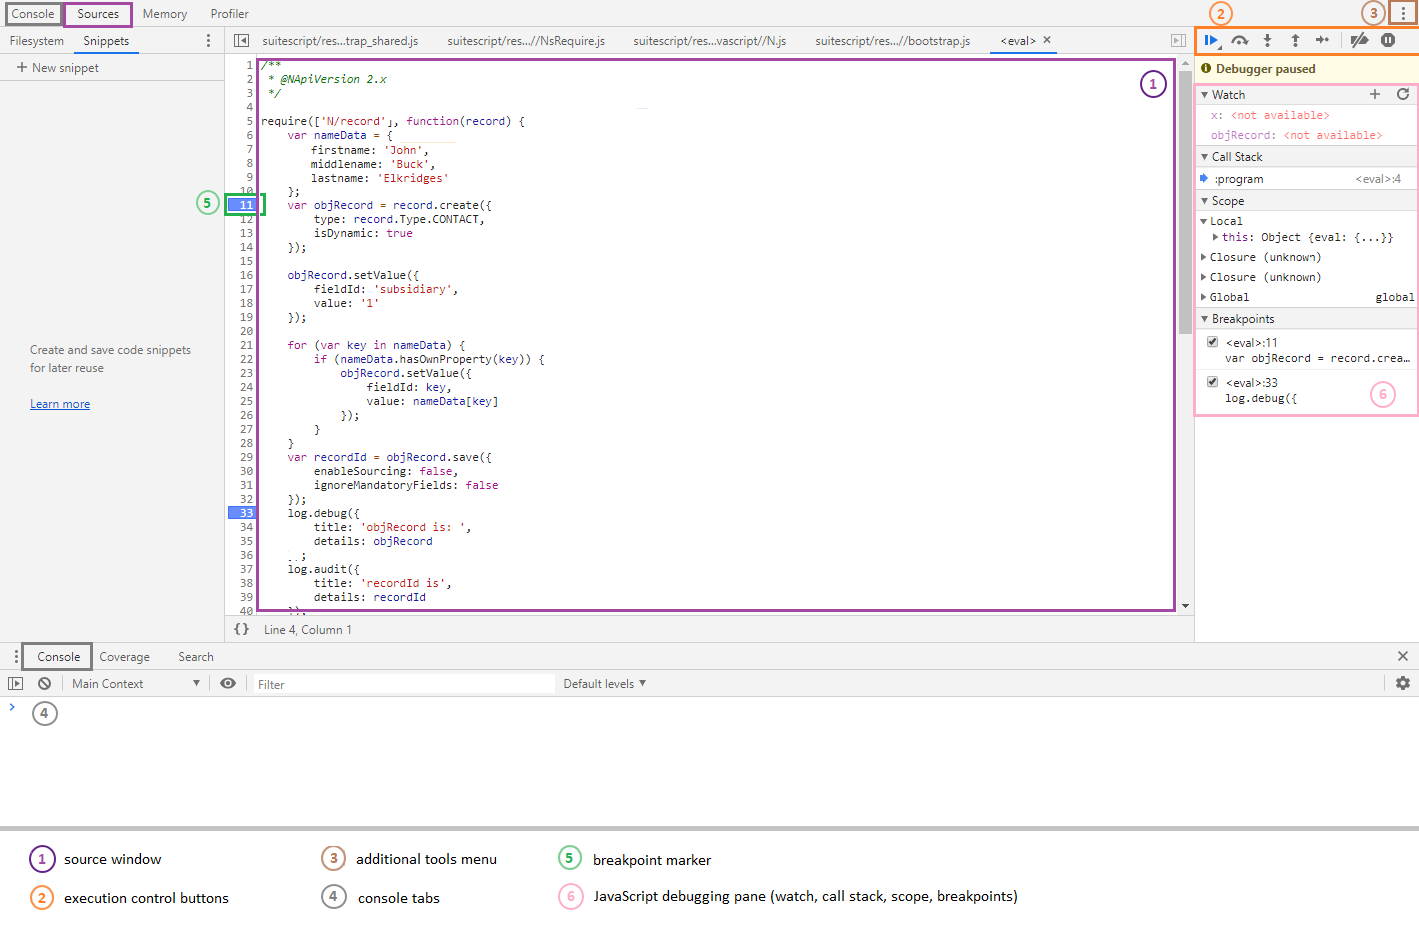
The following figure shows a sample Chrome DevTools Sources tab opened for debugging SuiteScript 2.1 scripts.
Chrome DevTools for SuiteScript 2.1 scripts supports the Console and Sources tabs only. Currently, there is no support for the Memory or Profiler tabs when debugging SuiteScript 2.1 scripts.

NetSuite’s use of Chrome DevTools for SuiteScript 2.1 script debugging adheres to all license parameters as described at Chrome DevTools License.
Using Chrome DevTools
When you start debugging SuiteScript 2.1 scripts using Chrome DevTools, you can set breakpoints, add watches, view the call stack, and start, pause, and resume script execution. Most of these tasks are performed in the 2.1 Script Debugger in the same way they are performed in Chrome DevTools. The following table provides quick instructions for different debug actions.
Debug action |
Steps |
---|---|
Set and remove breakpoints |
Breakpoints are shown in the Breakpoints section of the JavaScript debugging pane: ![]() To set a breakpoint, click to the left of the line of code in the Source window where you want the break to be set. A breakpoint marker is displayed: When execution is paused due to a breakpoint, a Paused on breakpoint message is displayed: ![]() To remove a breakpoint, click the breakpoint marker.
Note:
Breakpoints may “stick” between debugging sessions. If this happens, simply remove the breakpoints that you no longer need. |
Disable/re-enable breakpoints |
To disable all breakpoints, click the disable breakpoints button: To re-enable all breakpoints, click the re-enable breakpoints button: When all breakpoints are disabled, the breakpoints list is grayed out: ![]() |
Step through code |
To step over a line of code, click the step over button: To step into a line of code, click the step into button: To step out of a line of code, click the step out button: |
Pause and resume execution |
To pause execution, click the pause button: ![]() To resume execution, click the resume execution button: |
Restart execution from a line within the call stack |
To restart execution from a point in the call stack:
|
View and edit local, closure, and global properties |
SuiteScript and JavaScript objects can be viewed by expanding the Local, Closure, or Global sections of the JavaScript debugging pane: ![]() |
View current call stack |
To view the call stack, click the Call Stack header on the JavaScript debugging pane: ![]() You can also select a point in the call stack and resume execution from that point. |
Display the console |
You can display the console in the main debugger window or on the bottom pane of the debugger by clicking the corresponding Console tab. However, if you use the Console tab on the left side of the debugger, the source window closes. |
De-minify display of the script code |
Source code may be displayed minified when it is displayed on the Sources tab: ![]() This is often unreadable. You can de-minify the source (that is, add appropriate white space and new lines) by using the |
Watch variable and expression values |
Use the Watch window on the JavaScript debugging pane to see values of variables within your script and to evaluate expressions on-the-fly: ![]() To add a variable or enter an expression to evaluate, click the plus (+) button on the Watch window header and enter the variable name or expression. Notice in the above example, the variable being watched is a SuiteScript object so all available members of that object are displayed. |
Chrome DevTools supports keyboard shortcuts for nearly all actions available in the debugger. See Chrome DevTools Keyboard Shorcuts.
Your Chrome DevTools environment is retained between debugging session. For instance, if you open the Console window the first time you debug a script, Chrome DevTools will open with the Console window open in each subsequent debugging session.