Using the Script Execution Log Subtab
Script execution details are logged on the Execution Log subtab included on the Script page, Script Deployment page, and on the SuiteScript Debugger. You can search and customize the logs to find what you need.
The Execution Log subtab displays all dates and times in the local time zone set in the user preferences.
When you're using the SuiteScript Debugger to debug a script, all logging details appear on the Execution Log tab in the Debugger. You'll need to deploy the script first to see logging details on the Script Deployment page's Execution Log subtab.
The following figure shows two types of execution log messages for a Suitelet.
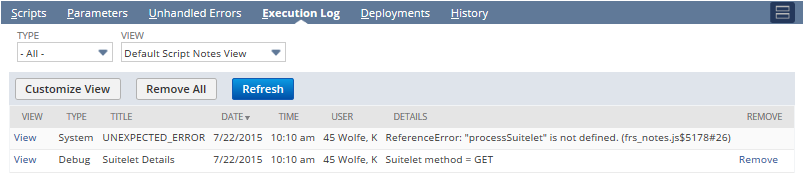
The first message is an unexpected error that is generated because a Suitelet script called an undefined method. The second message is user-generated by the following line(s) in this Suitelet code using the SuiteScript 2.1 N/log Module:
          log.debug({
    title: 'Suitelet Details',
    details: `Suitelet method = ${request.method}`
});
By default, the Execution Log subtab shows the Default Script Notes View. This default view shows all log types from the current day's script executions.
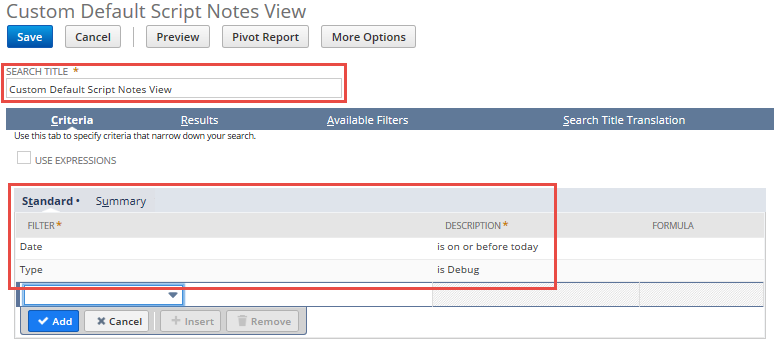
To view script executions for days other than the current day, click the Customize View button. Specify search criteria such as script execution dates, details, names, and script types, and then name your custom view in the Search Title field, as shown here:
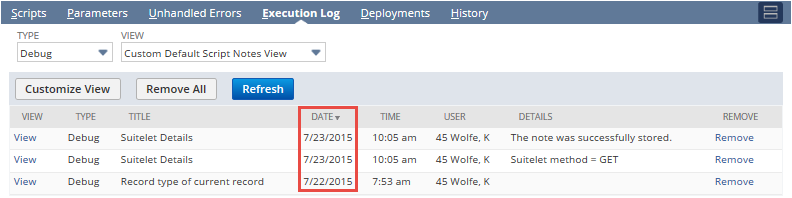
The following figure shows a customized view of the execution log. The new view type has been selected from the View list. This view shows log details for days other than the current day.
For more information about viewing script execution logs, see Viewing a List of Script Execution Logs.
Script execution logs are subject to retention and storage limits. For more information about governance of script logs, see Governance on Script Logging.