Data Tab
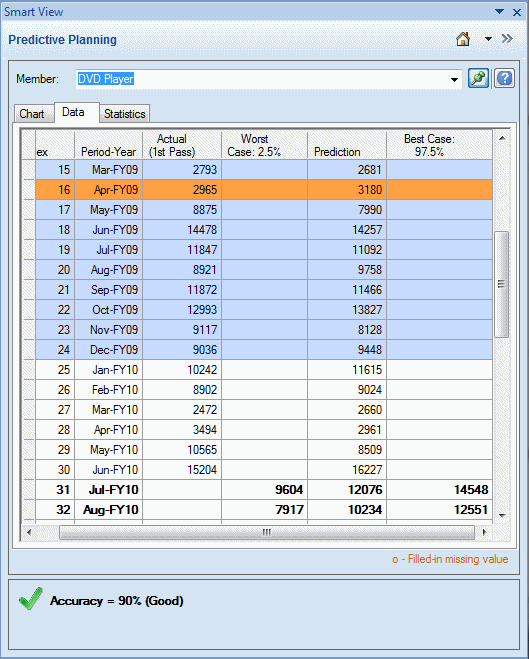
The Data tab shows a column for each data series displayed on the chart for the selected members (Figure 2-2). In the default display, columns for the Worst Case and Best Case data series are also included. As in the Chart tab, the Data tab is split into past and future data sections. The future data section is shown at the bottom of the data table in bold font.
Note:
Data values in the past section of the Prediction column are plotted as the prediction fit line when that data series is selected as part of editing a comparison view (Adding Prediction Data).
Figure 2-2 Predictive Planning Panel, Data Tab
