Creating Dashboards
Working with Dashboards describes Profitability and Cost Management dashboards.
Note:
For the URL dashboard component, only URLs from the following domains are supported:
ORACLE.COMORACLECLOUD.COMORACLEOUTSOURCING.COMORACLEDEMOS.COMORACLEADS.COM
To display the Dashboards screen:
-
On the Profitability and Cost Management Home page, click Dashboards,
 .
.
-
Or, click Dashboards while viewing the Intelligence screen.
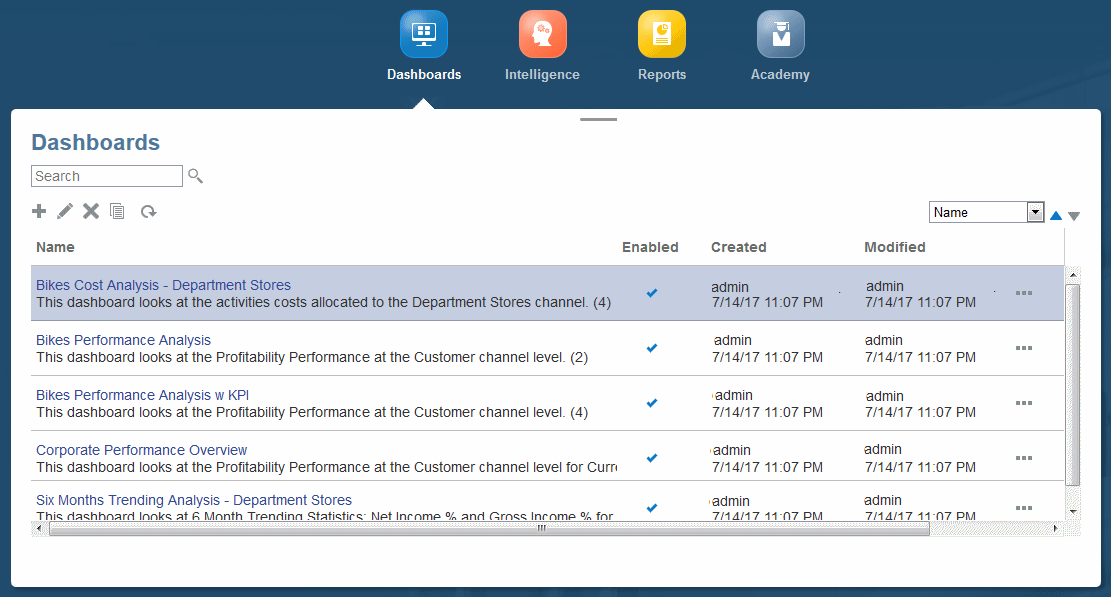
The Dashboards screen is displayed.
Figure 12-7 Dashboards Screen

The Dashboards screen lists and describes existing dashboards. To display one, click its name.
The Dashboards screen contains controls for searching, sorting, and managing dashbaords (Common Feature Controls).
To create a dashboard:
-
On the Dashboards screen, click Create,
 .
.
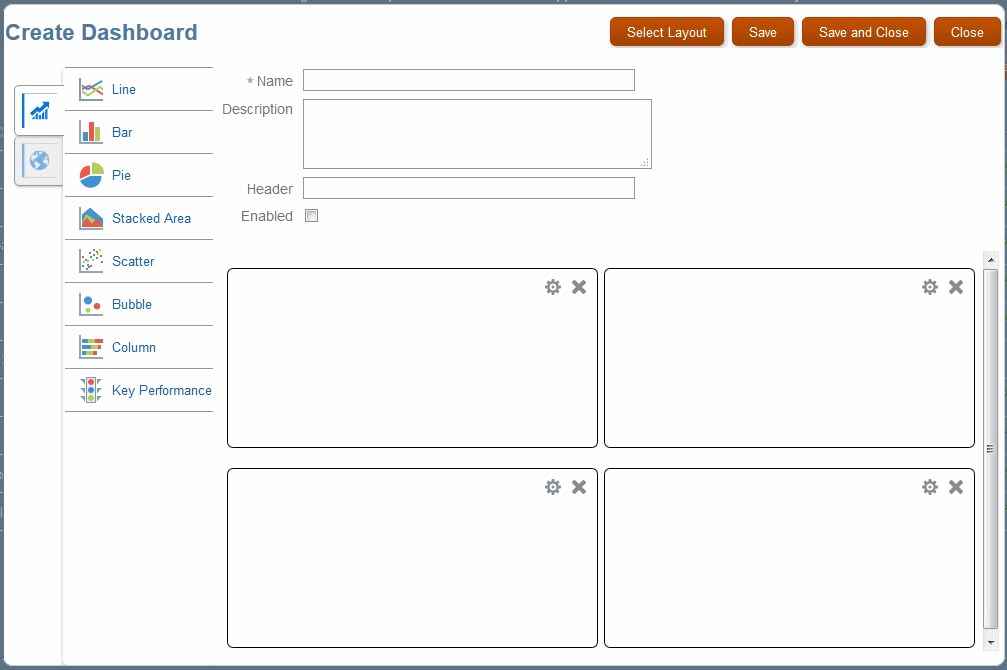
Figure 12-8 The Create Dashboard Screen

-
In the Create Dashboard screen, enter a name, an optional description, and a header label.
-
Click Select Layout to define the number of charts to display, from one to six. Click OK after selecting chart squares to include.
Click squares to include them. The placement of the shaded squares determines whether rectangular layouts are vertical or horizontal.
-
Drag a chart type to each empty chart square in the Create Dashboard screen.
Note:
Key Performance inserts a Key Performance Indicator (Working with Key Performance Indicators).
-
Click the settings button,
 , in each chart square to select what to display there.
-
Header, a label that describes the chart contents
-
Analysis View, a defined analysis view that provides data for the chart
-
Lines, Pie Slices, and so on, analysis view members to include in the chart
-
-
Optional: Click the URL tab to enter a URL or custom text in any dashboard.
Note:
The target URL must support being loaded as a frame by an outside client.
-
When all the dashboard charts are defined, select Enabled, and then click Save or Save and Close.
The new dashboard is listed and ready for use.
To display a dashboard with the latest data, see Displaying Dashboards
To edit an existing dashboard, see Editing Dashboards.