Working with Dashboards
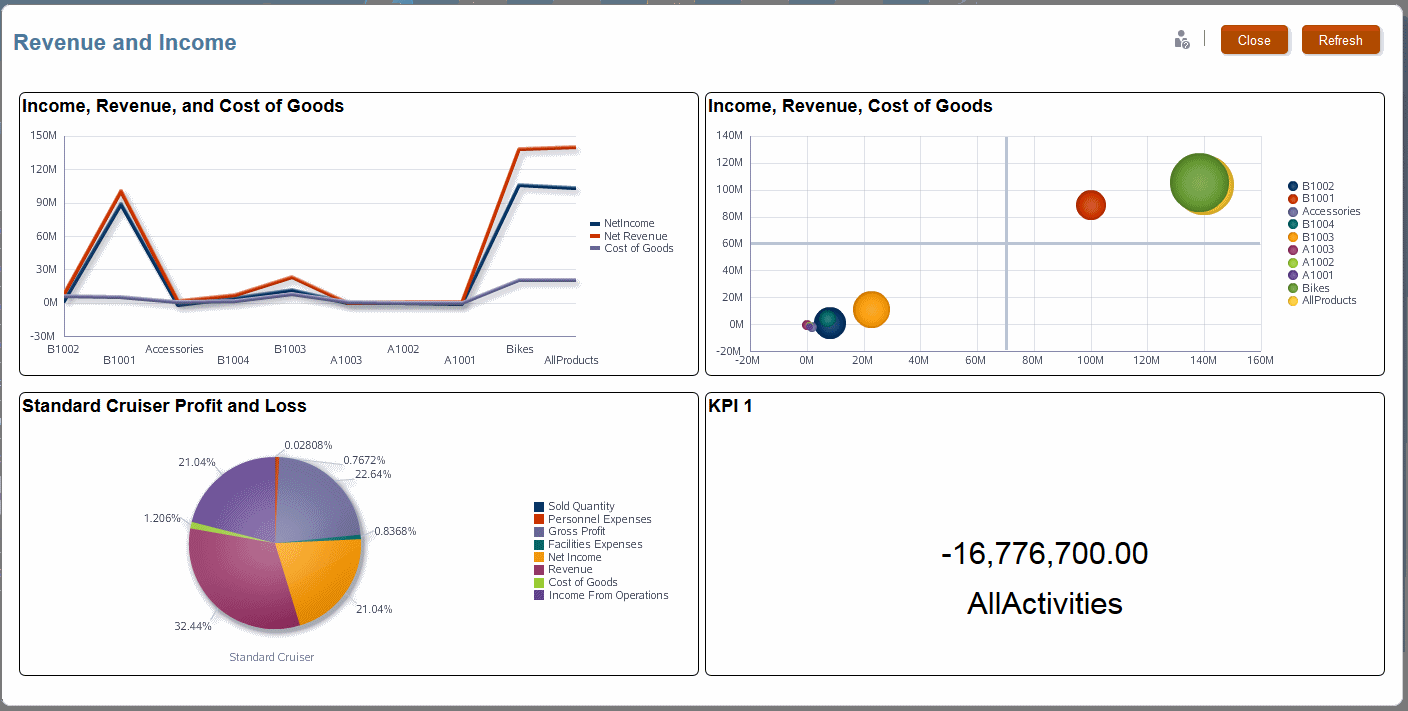
Dashboards in Profitability and Cost Management are sets of small-scale charts that display values and trends.
They are based on analysis views (Working with Analysis Views). As with other analytics features, virtually all users can view dashboards after they are defined by administrators and others with sufficient security provisioning.
Figure 12-6 A Four-cell Dashboard
