Working with Key Performance Indicators
Key Performance Indicators (KPIs) are display tiles that show one value for one dimension.
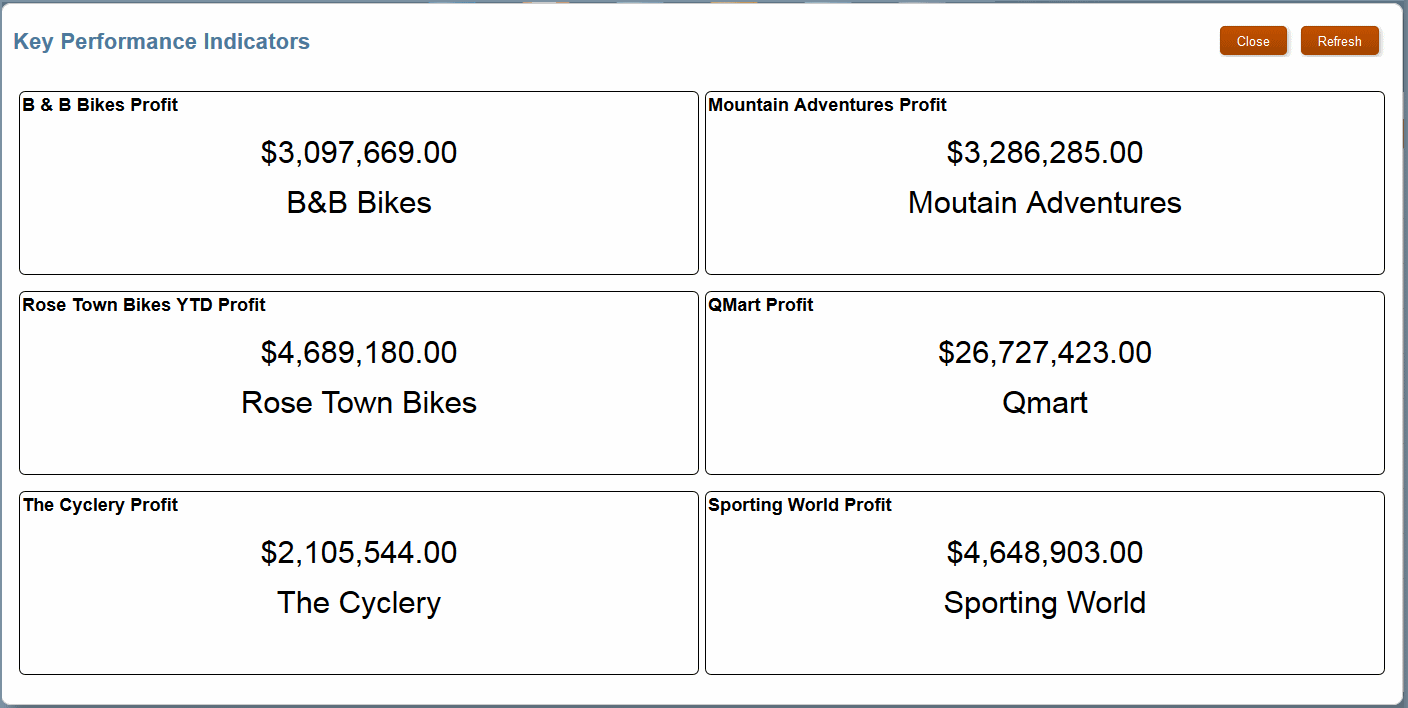
For example, you might show net income for a customer for the previous quarter. The measured dimension, such as Customers, is called the population dimension. Once a value is retrieved for a member of the population dimension, that value can be treated in a number of ways (ranked, averaged, summed, and so on). You can also assign it to a score range with a label, such as Fair or Poor. You can use member functions for comparison with previous single numbers (such as the previous quarter) or groups of members (the last three quarters). KPIs are most frequently displayed with dashboards (Working with Dashboards). The following figure shows a dashboard with six KPIs.
Figure 12-16 Key Performance Indicators in a Dashboard
