Defining Key Performance Indicators
Working with Key Performance Indicators describes Key Performance Indicators.
To display the Key Performance Indicators screen:
-
Click the Intelligence icon,
 .
.
-
Click the Key Performance Indicator tab,
 .
.
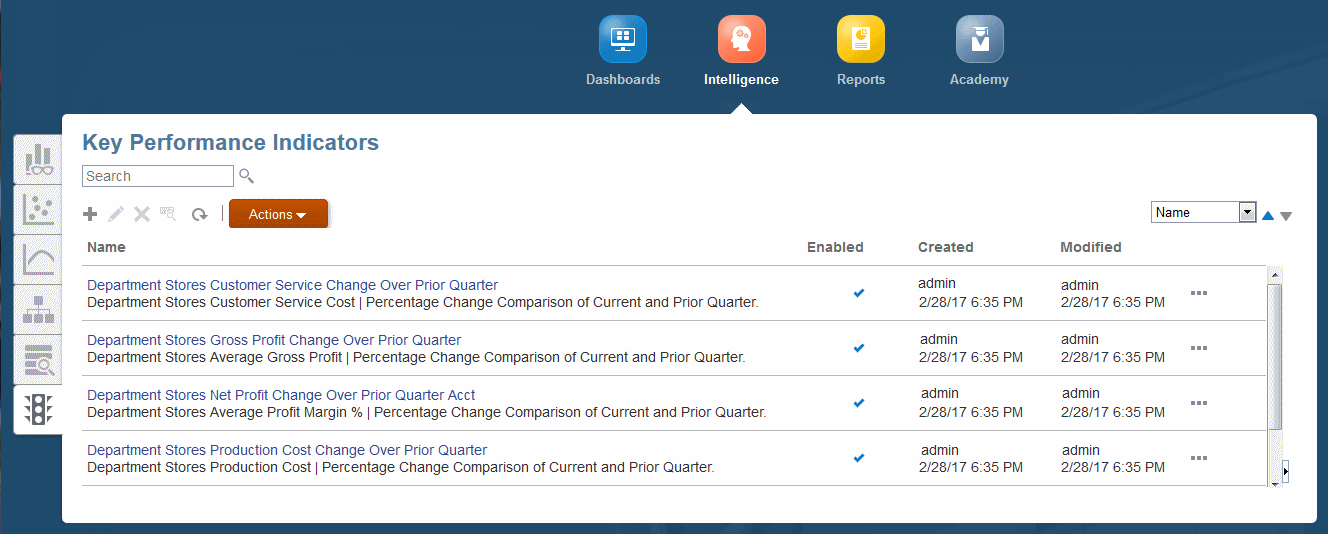
Figure 12-17 Key Performance Indicators Screen

The Key Performance Indicators screen contains the following controls: Create, Edit, Delete, Inspect, and Refresh. The name of each displays when you point to it. You can also Search entered text and Sort selected columns. For control descriptions, see Common Feature Controls.
The Actions menu offers two options:
-
Copy -- Saves the selected graph with a different name.
-
Diagnose -- Displays underlying queries and other information for you to view and save as a file.
Note:
The control functionality and Actions menu options are also available through the Actions button, ![]() .
.
To create a KPI:
-
On the Profitability and Cost Management Home page, click
 , and then click
  .
.
-
In the Key Performance Indicators screen, Figure 12-17, click Create.
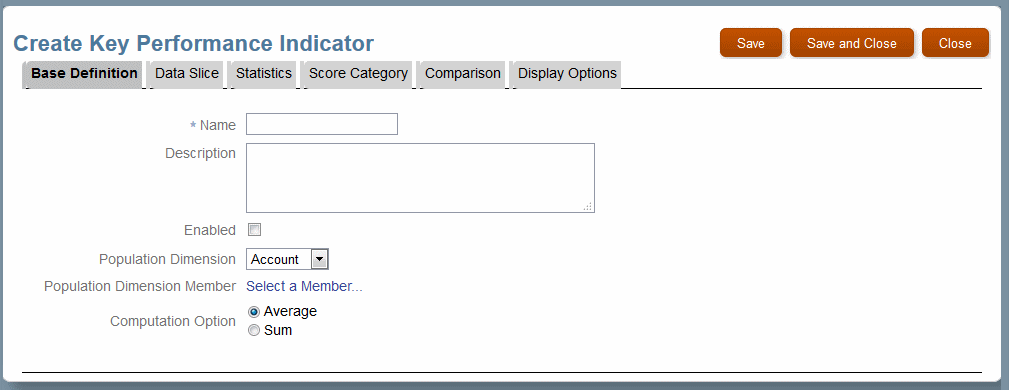
Figure 12-18 Create Key Performance Indicator

-
In the Base Definition tab, do the following:
-
Enter a Name for the KPI.
A descriptive name is helpful, since it labels the KPI.
-
Optional: Enter a Description.
-
Select a Population Dimension, the thing that you want to measure.
The Population Dimension choice determines what a key performance indicator can be ranked against.
-
Select a Population Dimension Member to measure.
It can be a single member, such as one product or customer, or a group, such as a type of retail outlet.
-
Select a Computation Option, either Average or Sum.
This determines the final presentation of the selected measure if a multiperiod function is used in the Comparison tab (so that multiple values would be returned).
-
-
Optional: Click the Data Slice tab to further identify the data point to be used for the key performance indicator.
You can drill down and select a member from any or all of the displayed dimensions. For example, suppose you select Period, Q1, February, Any further definition elements you apply will be based on February data for the selected Population Dimension Member.
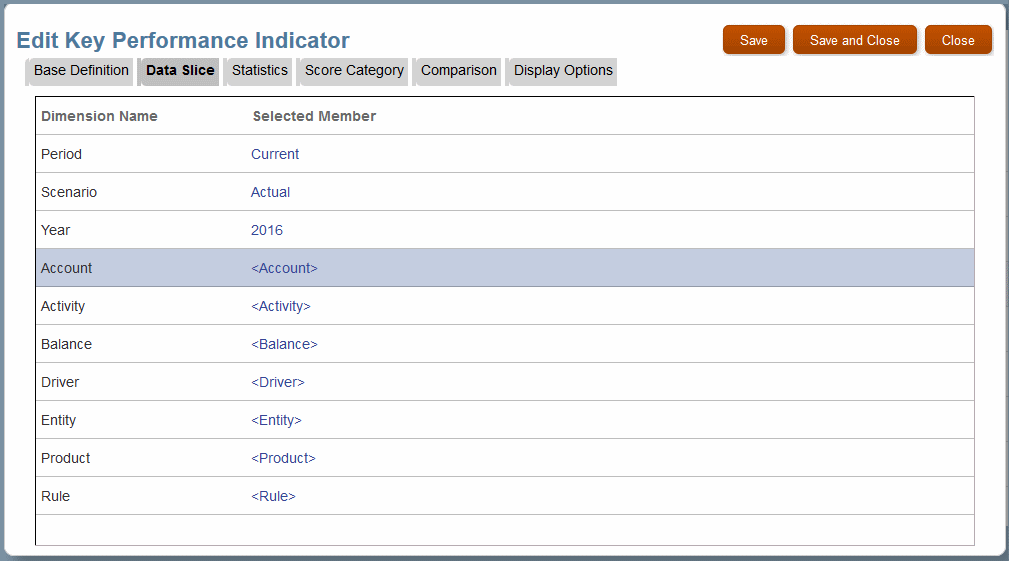
For example, the following figure shows that the first three dimensions have selections as shown and no other dimensions are selected.
Figure 12-19 Data Slice Tab with Three Dimensions Selected

Note:
In this example, Period was set to Current using the Member Function option on the Member Selector screen. For more information about member functions, see Using Member Functions.
-
Optional: Click Statistics to further define the Population Dimension Member analysis.
You can select from Rank, Average, Median, Quartile, or None to look at values divided by that statistic. The statistical value for the Population Member displays in the KPI tile.
-
Optional: Click Score Category to assign labels to ranges of values that can apply to the Population Member.
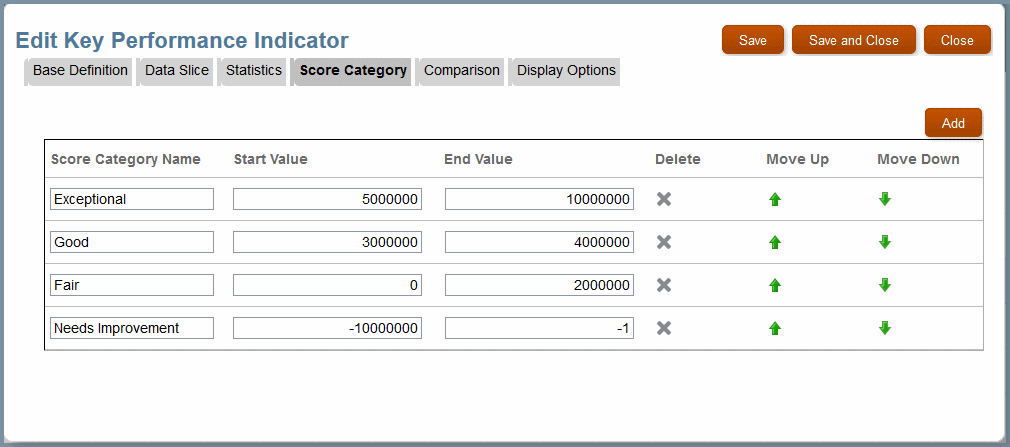
Click Add to add a Score Category Name, a Start Value, and a higher End Value for the category. For example, the following figure shows possible profit levels for customers. If the selected customer had a loss, the KPI tile shows "Needs Improvement".
Figure 12-20 Example of Key Performance Indicator Category Definitions

-
Optional: Click Comparison to define a comparison of the current KPI value with one from another time period or year. You can choose a Value Comparison or Percentage Comparison.
If you select one of the comparison options, controls for Comparison Dimension and Comparison Member open.
-
For Comparison Dimension, select Period or Year.
-
For Comparison Member, select a quarter (and month, if you prefer), or a year, depending on the Comparison Dimension selection.
Note:
Alternatively, you can select Member Function to choose a period or year relative to the current one (Using Member Functions).
-
-
Optional: Click Display Options to use aliases for dimension names and to include a symbol or label before or after the value displayed in the KPI tile.
For example, you could type $ in the Value Prefix box or € in the Value Suffix box, depending on whether the value was in dollars or euros.
-
When settings are complete, click the Base Definition tab, and then select Enabled.
-
Select Save and Close to display the Key Performance Indicators screen with the new KPI.
-
To display the KPI, click its name in the Key Performance Indicators screen.