The Solution, and How It Works
You can reverse ledger complexity while increasing efficiencies in both accounting and operational data management.
Leave the statutory data in the general ledger where it belongs and move the purely operational data to Profitability and Cost Management
There are several ways to add structure and data to Profitability and Cost Management applications (Creating, Importing, and Exporting Applications in the Profitability Application Console). See the following sections for more information:
-
Create an application shell. Then, import specially formatted flat files containing dimension definitions (see Creating Applications with Dimensions from Flat Files).
-
Add a previously exported application using a template file. Template files contain dimensions, metadata, and other artifacts created by exporting templates from existing Profitability and Cost Management applications (see Building Applications by Importing Template Files).
Once your general ledger and operational data is added to the system, you use the Profitability and Cost Management rule designer to distribute funds between funding sources and destinations using a simple interface.
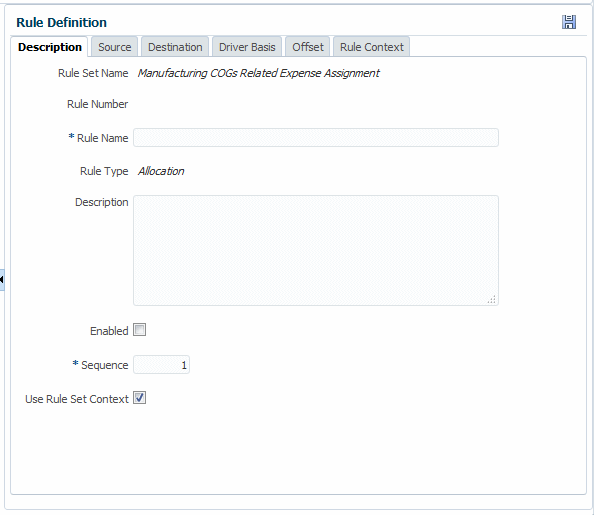
Figure C-1 The Rule Definition Area

Use each tab to define a rule:
-
On Description, enter a rule name, optional description, sequence number, and other information that determines when and how the rule runs.
-
On Source, select dimension members that supply funds to allocate. You can also specify an amount or percentage to allocate and select a calculation segmentation method.
-
Destination determines the dimension members that will receive incoming funds.
-
Driver Basis indicates whether funds are allocated evenly or allocated with a formula in the specified dimension member.
-
Offset supports alternate locations to hold an increase that balances a corresponding decrease in the allocation source.
-
Use Rule Context to set up default members for new rules.
For details, see "Working with Oracle Profitability and Cost Management Cloud Rules" in Administering Oracle Profitability and Cost Management Cloud.
You can further refine the allocation process by creating rule sets, logical groupings of rules that run together in a desired sequence. You can also define contexts, defaults that form the basis for new rules.
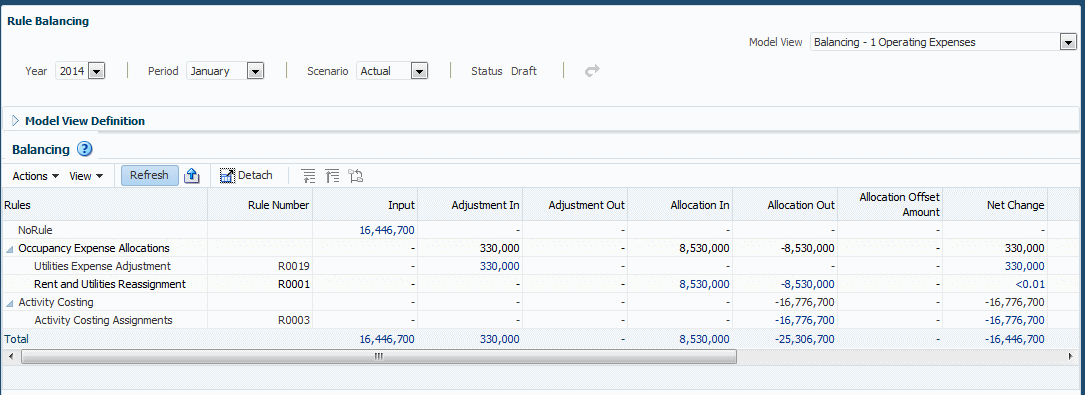
After you deploy the application and calculate the data, you can use the Rule Balancing screen to visually track the flow of allocations through the system. Live links open Oracle Smart View for Office for additional exploration and deeper analysis.
Figure C-2 Rule Balancing Screen with Data

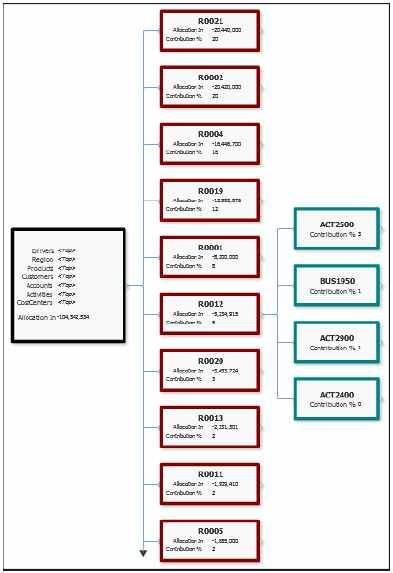
Allocation tracing provides a graphic view of the relationship among parts of an application.
Figure C-3 Trace Allocations Area with Nodes, Tracing Back

Together, rule balancing and allocation tracing help you validate application logic.