Viewing Allocation Trace Results
When you first perform a trace, the focal node is displayed.
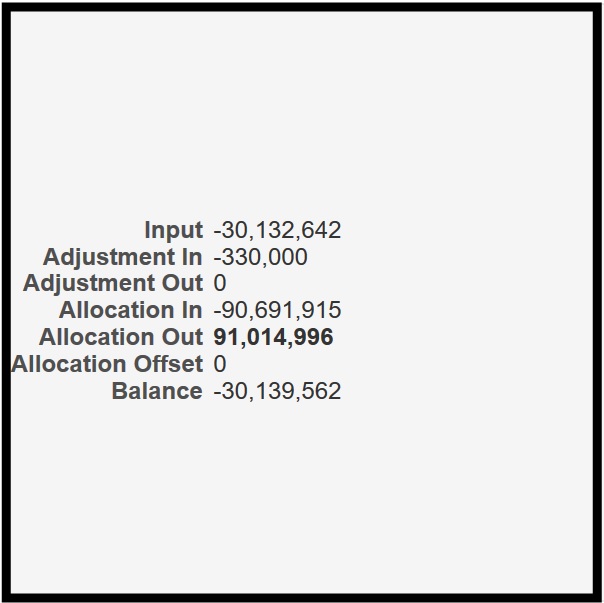
Figure 9-6 Allocation Trace Focal Node Example

At full size (100% "zoom"), the focal node shows the following: balance, input, adjustment in, adjustment out, allocation in, allocation out, and allocation offset amount.
If the focal node is only partially visible, you can use the Zoom and Center tool to move it:

Click the dot in the center to center the chart. Click the arrows to move the chart background. This has the effect of moving the chart in the opposite direction.
When you point to the middle of the right edge of the focal node, a + (plus) sign is displayed:

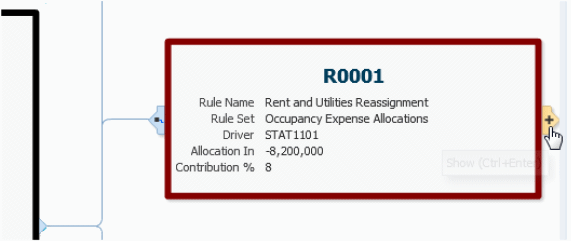
You can click the + sign to expand the chart and show the rule nodes (Figure 9-7).
Figure 9-7 Allocation Trace Rule Node

At 100% zoom, a rule node shows the rule number, name, and rule set. It also shows the allocation driver, allocation in (back trace, allocation out (forward trace), and the contribution to the total allocation shown in the focal node.
If you point to the right edge of the rule node, you can click the + sign to show the dimension nodes (Figure 9-8). If you click the symbol on the left side, the rule node detaches and is displayed without the rest of the chart. Click the arrow symbol to return to the chart view.
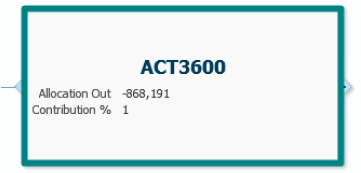
Figure 9-8 Allocation Trace Dimension Node

At 100% zoom, the dimension nodes show the member name, allocation out (back trace), allocation in (forward trace), and percent of contributin to or from the focal node. If you click the symbol on the left edge of the node, it detaches from the rest of the chart. Click the arrow to restore it.
Additional Chart Controls
The remaining chart controls perform the following actions:
-
 — Changes the configuration of the node tree
-
 — Zooms out to display as much of the chart as possible. Up to ten rule and dimension nodes are displayed; arrows following the last node of each type indicate that there are more to display.
-
 — When clicked, enlarges the chart by a step (zooms in)
-
 — When clicked, shrinks the chart by a step (zooms out)
Note:
As you zoom in and out, an arrow moves between the two Zoom icons to show the relative degree of "zoom".
-
 — Hides the control panel; click to show it again
For Zoom levels of 100%, 75%, and 50%, hyperlinks display for AllocationIn and AllocationOut amounts on the focal node and rule nodes. You can click these to launch Oracle Smart View for Office , similar to the way ilinks work in the Rule Balancing screen.