Manager Survey Analytics
As a manager, review and analyze feedback from your employees on important topics using the new Survey Analytics UI. You can create a survey on many different topics that are relevant to you and your employees. For example, find out if they're happy with their work environment, do they want more training, do your employees want to develop their skills and competencies, are they satisfied with their projects and schedule of work. When you design the survey, you decide how you want to display the analytics. For example, for single and multiple choice questions, you can display the results as a pie chart, donut chart, vertical bar graph or horizontal bar graph. Find the Create Survey UI under My Team.
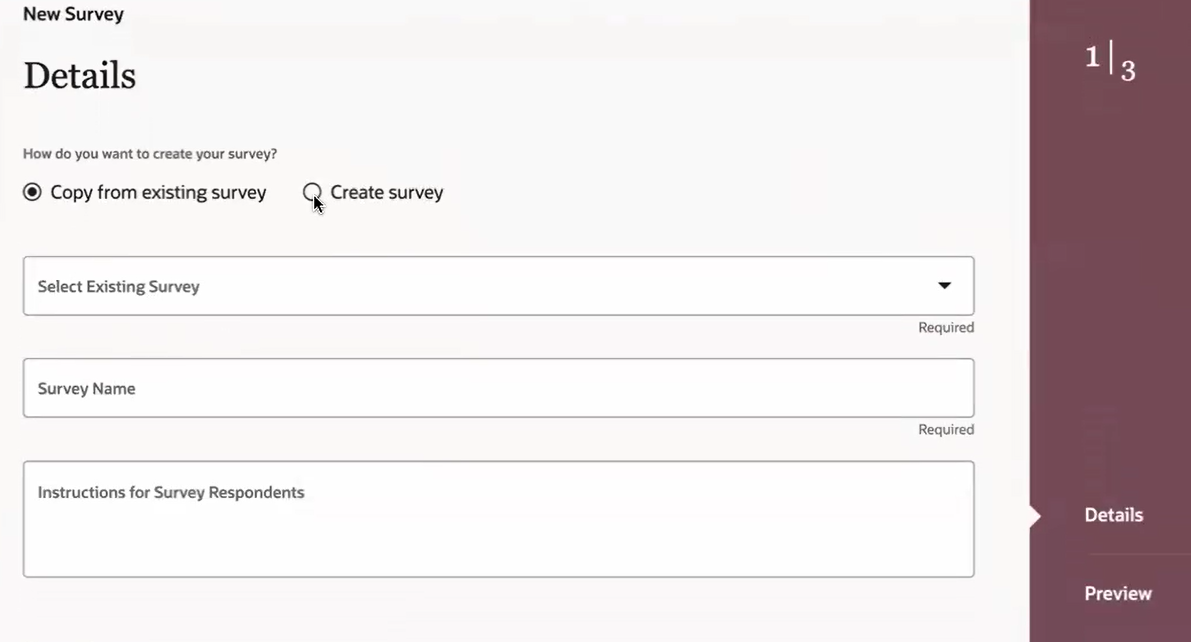
New Survey
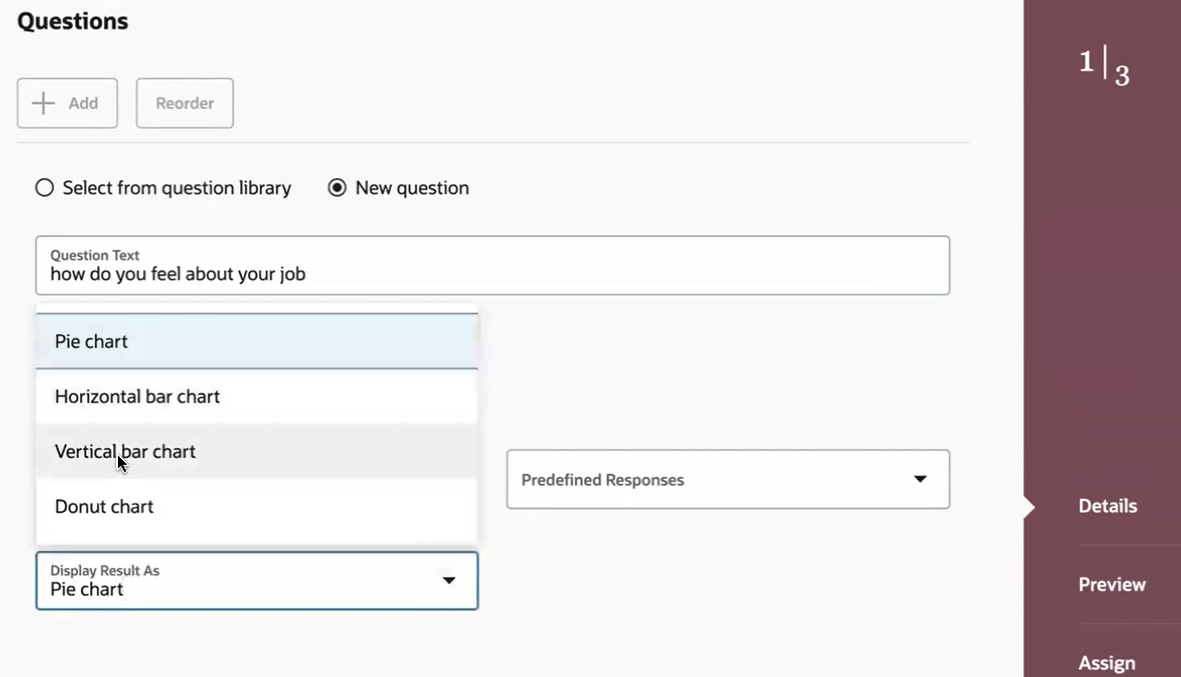
Display the Survey Results As
Use the new Survey Analytics UI to see how many people took the survey you assigned to them and the results of the survey based on their responses. You can also view the individual text responses of each participant. Find the results of the survey in Journeys Activity Center under the Explore tab.
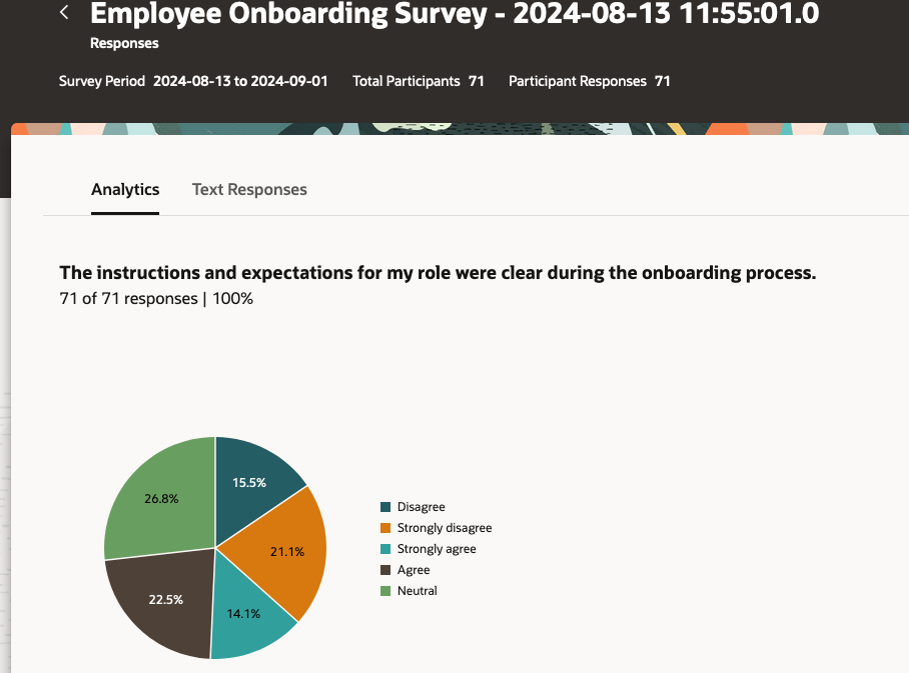
Survey Analytics
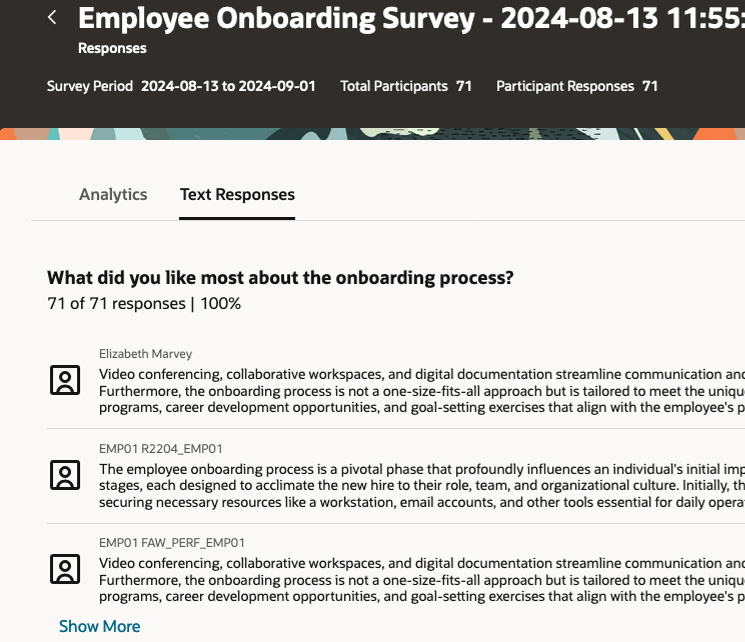
Text Responses from the Survey
Use the survey's results and analytics to help your employees by making adjustments and reviewing important decisions based on their feedback.
Steps to Enable
You don't need to do anything to enable this feature.
Tips And Considerations
To see the survey results and analytics, run the Process Survey Response Summary process daily.