Manager Survey Analytics using Generative AI
We have enhanced the Manager Survey Analytics UI which uses Generative UI (Gen AI). You now have the ability to review and analyze the sentiments expressed by survey respondents and view a summary of the responses. For example, you can see these results for the survey:
-
Analytics displayed as a pie chart, donut chart, horizontal bar graph, or vertical bar graph for choice based questions.
-
Sentiments associated with each individual textual responses. The sentiments can be positive, negative, and neutral.
-
Summary of text responses.
Enable Sentiment Analysis and Summarization
When you create questions of response type text for the survey, you can select the Enable Sentiment Analysis and Enable Summarization options. You select these options so that Gen AI can generate the sentiment analysis and summarization.
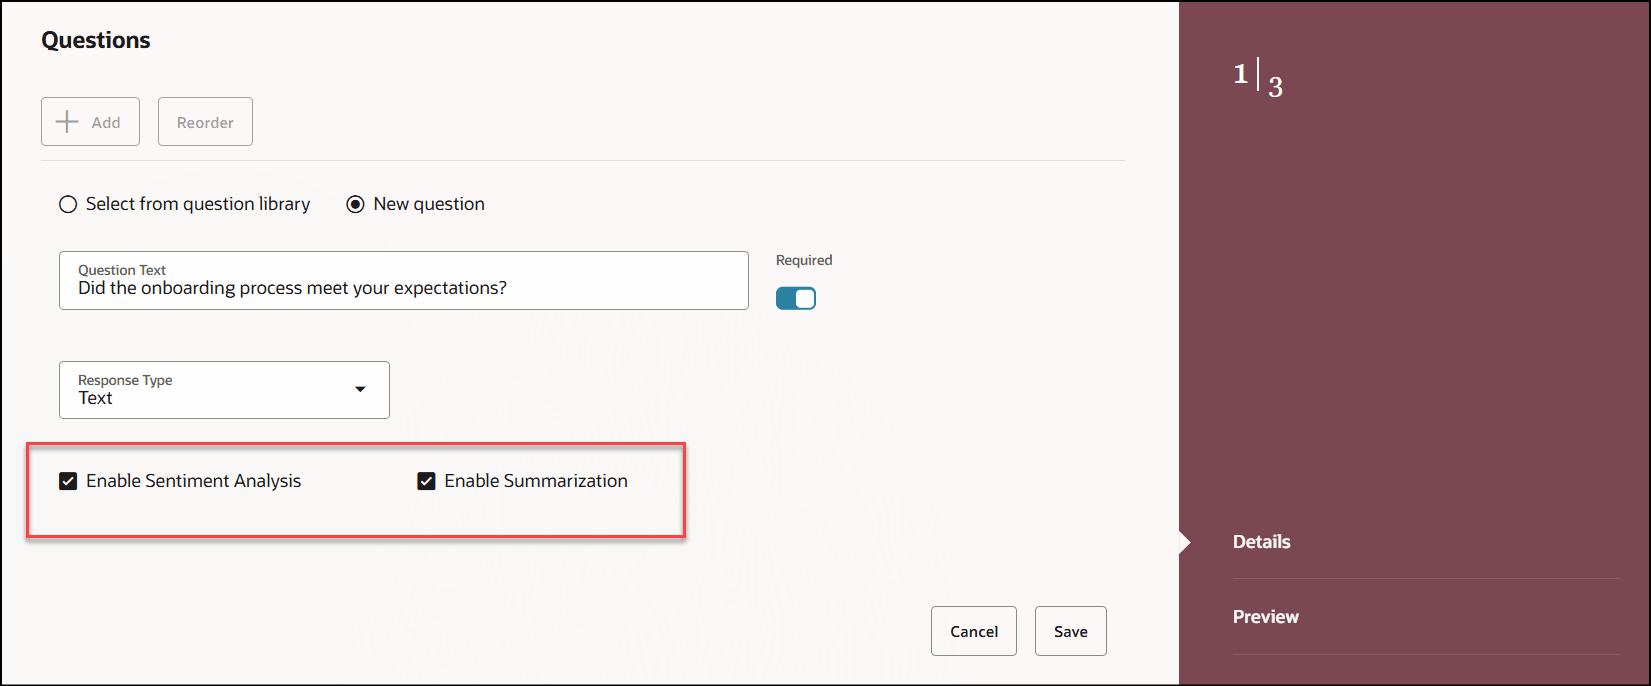
Enable Sentiment Analysis and Summarization for Textual Response
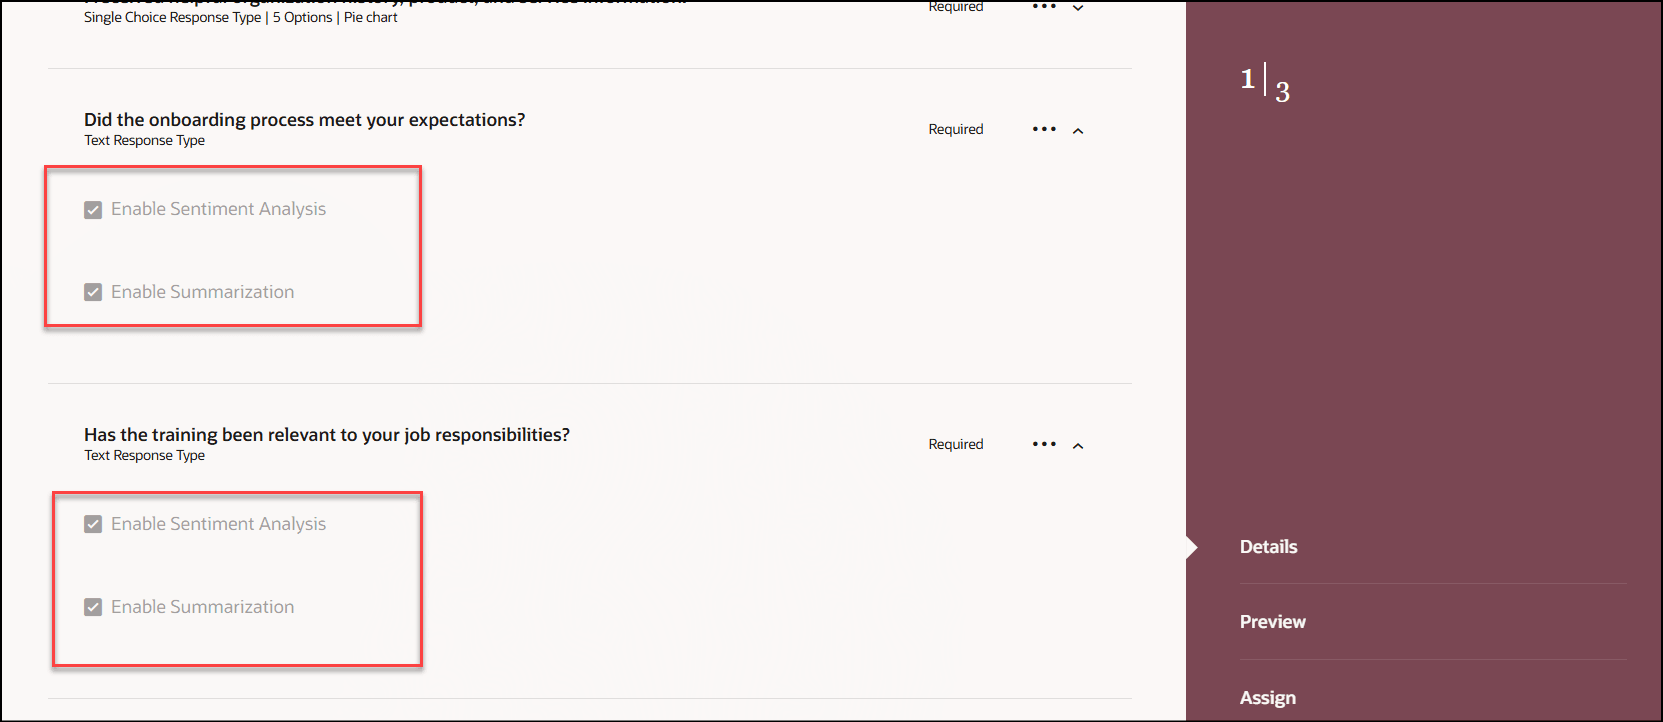
Enabled Sentiment Analysis and Summarization Displayed for Textual Responses
View Response Summary
When you view activity for the Manager Survey journey, you can click the Response Summary icon to view the analytics and summarization of the question responses provided by survey participants.
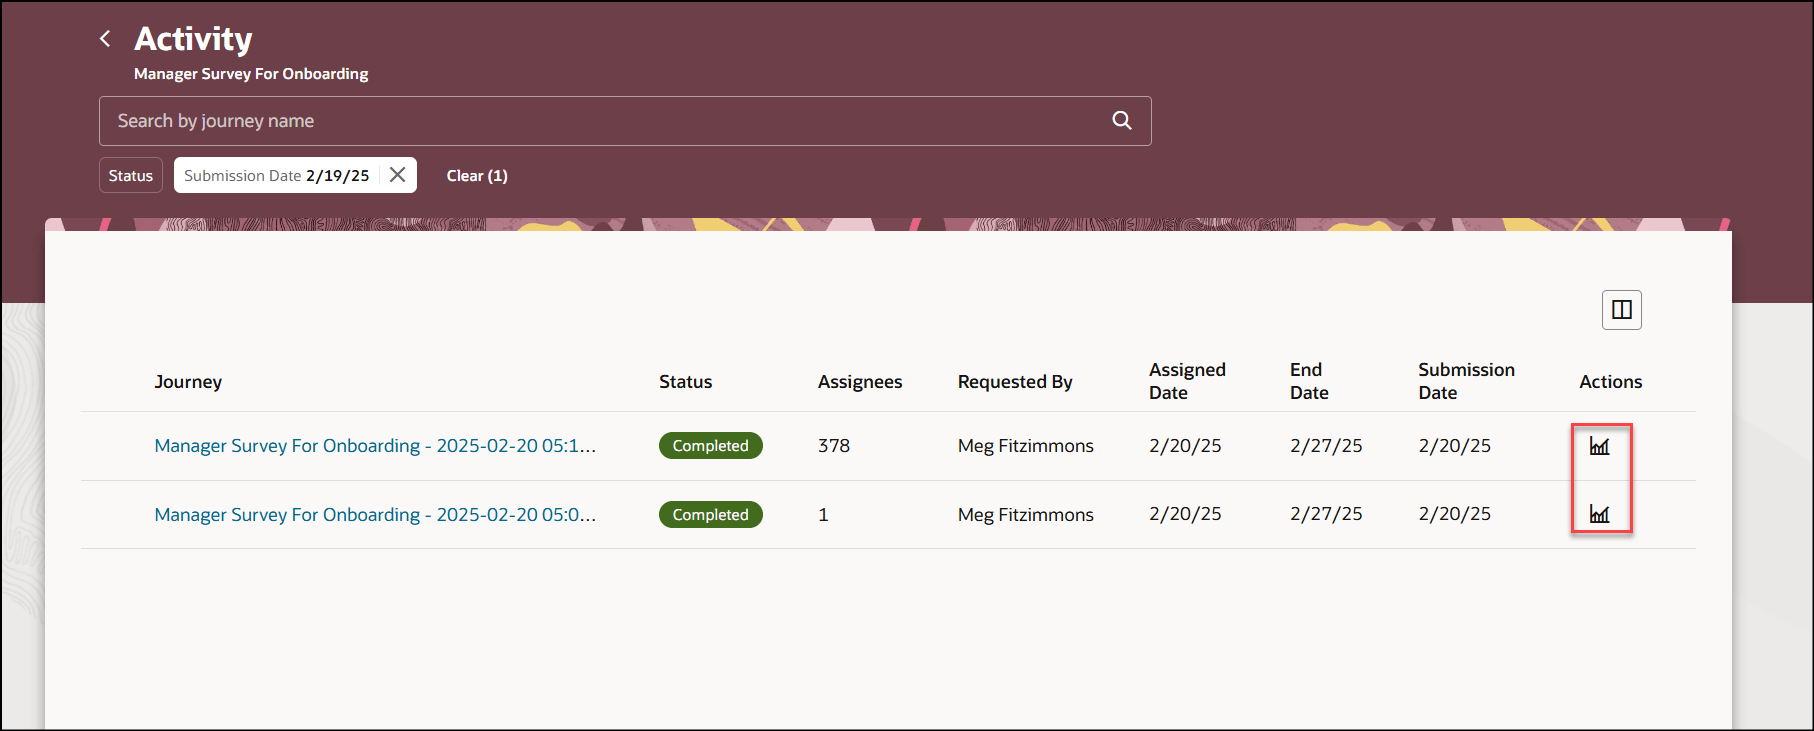
View Response Summary for Manager Survey Journey
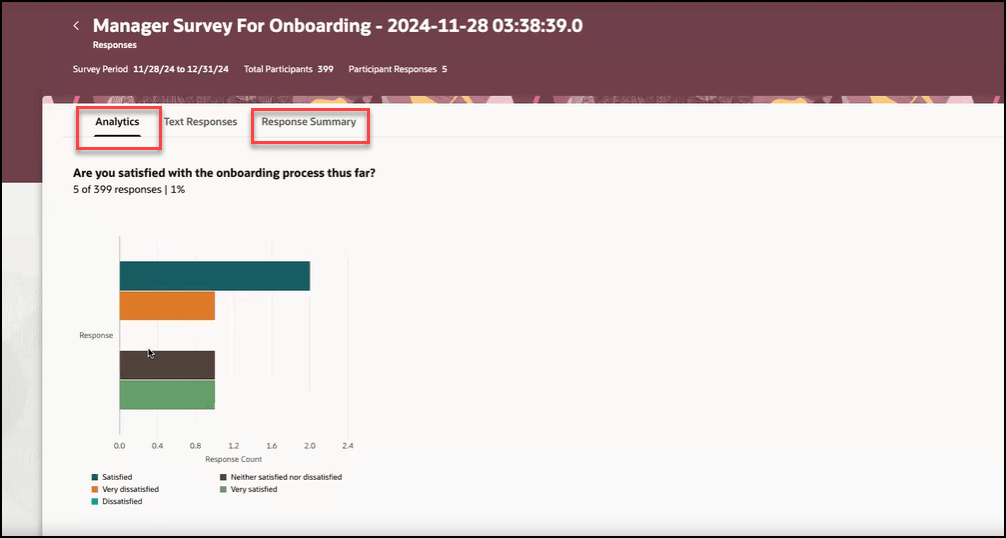
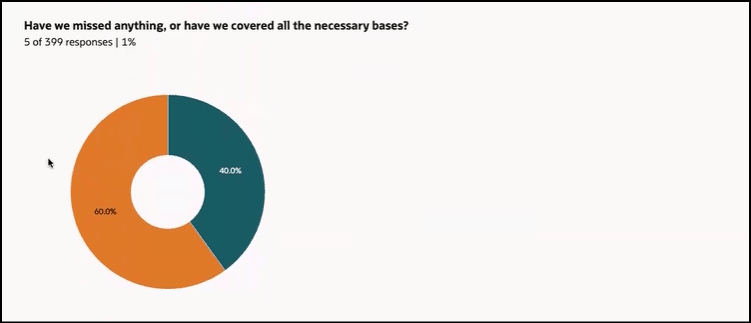
The Analytics tab displays the analytics for questions with single and multiple choice responses in the form of a pie chart, donut chart, horizontal bar graph, or vertical bar graph. You choose the chart or graph options when you configure the questions for the survey.
The choices selected by survey respondents for single and multiple choice questions are analyzed and displayed in the form of graphs or charts. Additionally, the analyzed sentiments are grouped together and displayed as a pie chart in the Analytics tab.
Analytics Using Horizontal Bar Graph

Analytics Using Vertical Bar Graph
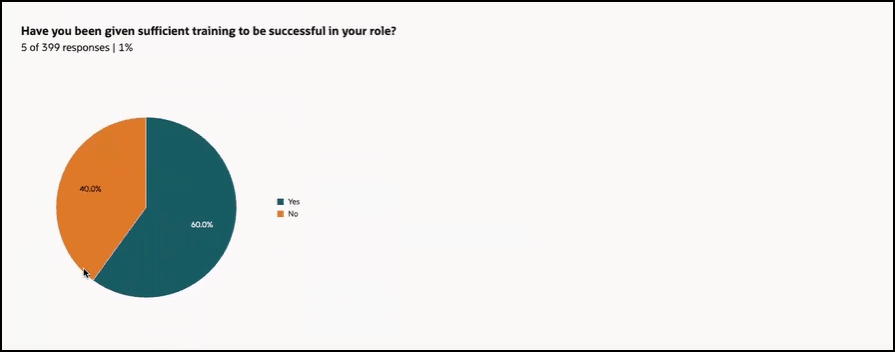
Analytics Using Pie Chart
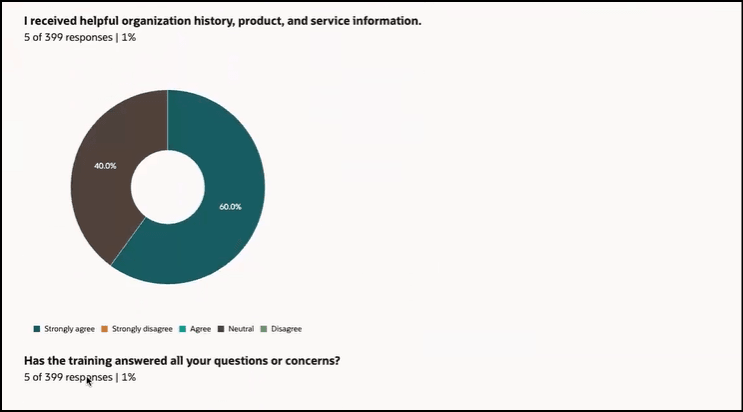
Analytics Using Donut Chart
After the analytics for the single and multiple choice questions, the analytics for questions with textual responses are displayed.
Analytics for Textual Response Questions
The Text Responses tab displays the sentiments associated with each textual response. The sentiments can be positive, negative, and neutral. For a positive sentiment, a smiley icon is displayed and a sad face icon denotes a negative sentiment.
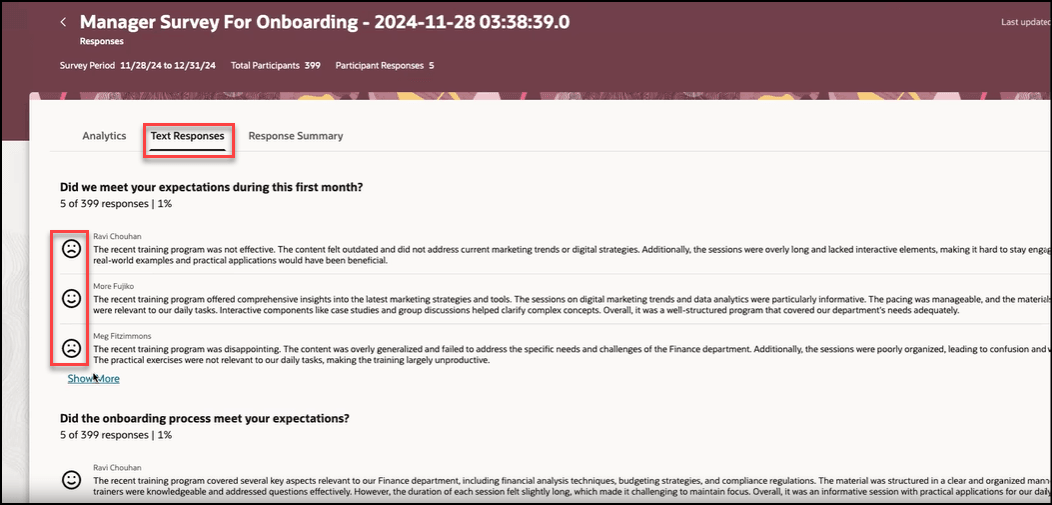
Sentiments for Textual Responses
The Response Summary tab is now added to show the summary of the responses received for each individual question with a textual response. Based on the sentiments and feedback received, Gen AI generates the summary.
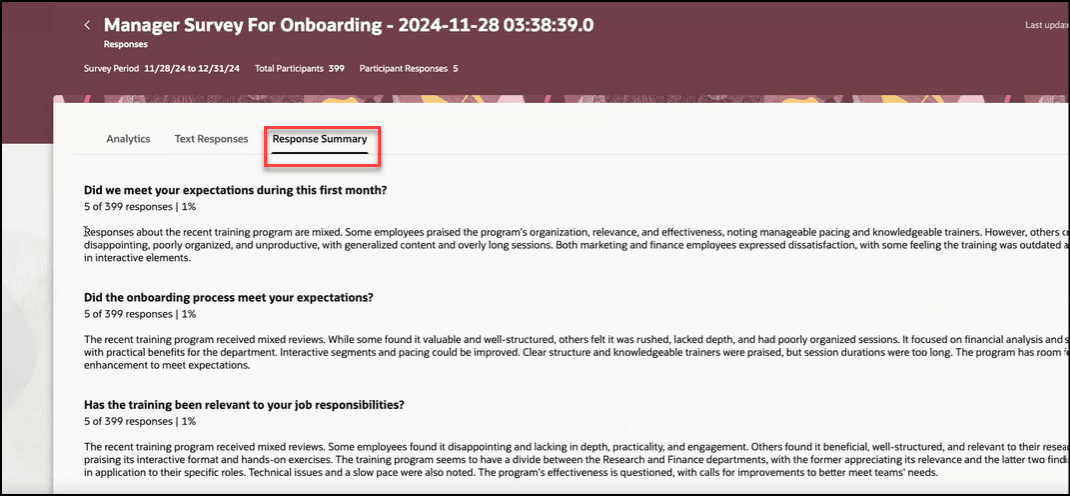
Summary for Textual Responses
If there are no responses for a question, a relevant message is displayed in the response summary.
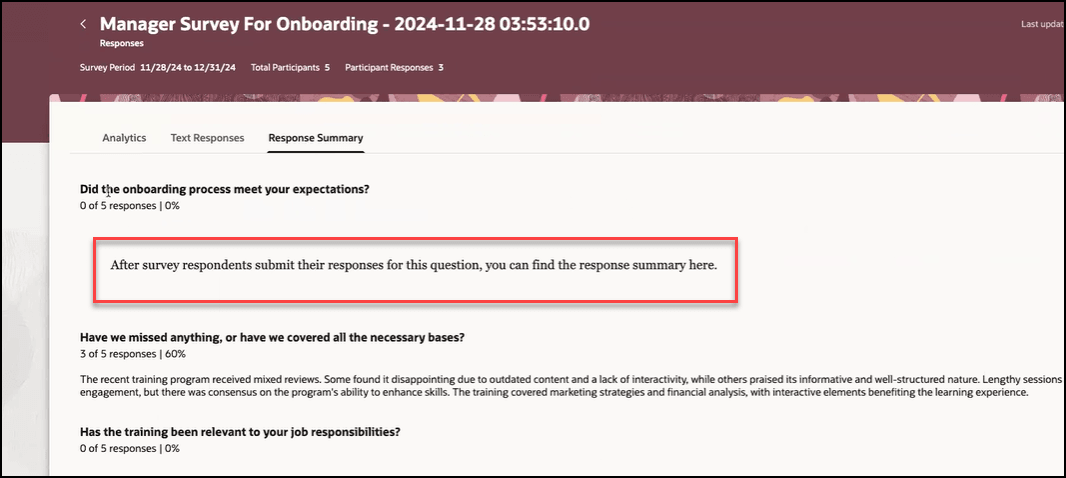
Message for Question with no Responses
Users can review the information to easily extract key insights and understand the emotional tone behind each response to make a much more informed decision. This feature offers a quick and efficient way to extract the valuable feedback provided by employees, which can otherwise be lost if a manager has to go through individual responses.
Steps to Enable and Configure
To enable the sentiment analysis and summarization, refer to this topic: How do I enable sentiment analysis and summarization for the text responses in a survey journey?
Tips And Considerations
-
To see the sentiment analysis and summarization, run the Process Survey Response Summary process daily.
-
The responses are processed only for those questions having the Enable Sentiment Analysis and Enable Summarization options enabled.
Key Resources
For more information, refer to these resources:
-
Manager Survey Analytics, What's new, 24D.