 Multi-Stop Bulk Plan Diagnostics
This feature provides you with additional information and diagnostics focused on multi-stop planning. As part of this feature a new button has been added to the Bulk Plan Results Page that provides access to the Multi-stop diagnostics screen. This screen shows the savings results for all of the combinations that are tried when optimizing the multi-stop shipments. It provides information on the costs and distances that drove the pairs of input shipments to combine.
This additional diagnostics is invoked with a new planning parameter and also requires that diagnostics be activated. Additionally, a matrix of the costs can be exported to provide a spreadsheet analysis tool for the multi-stop optimization process.
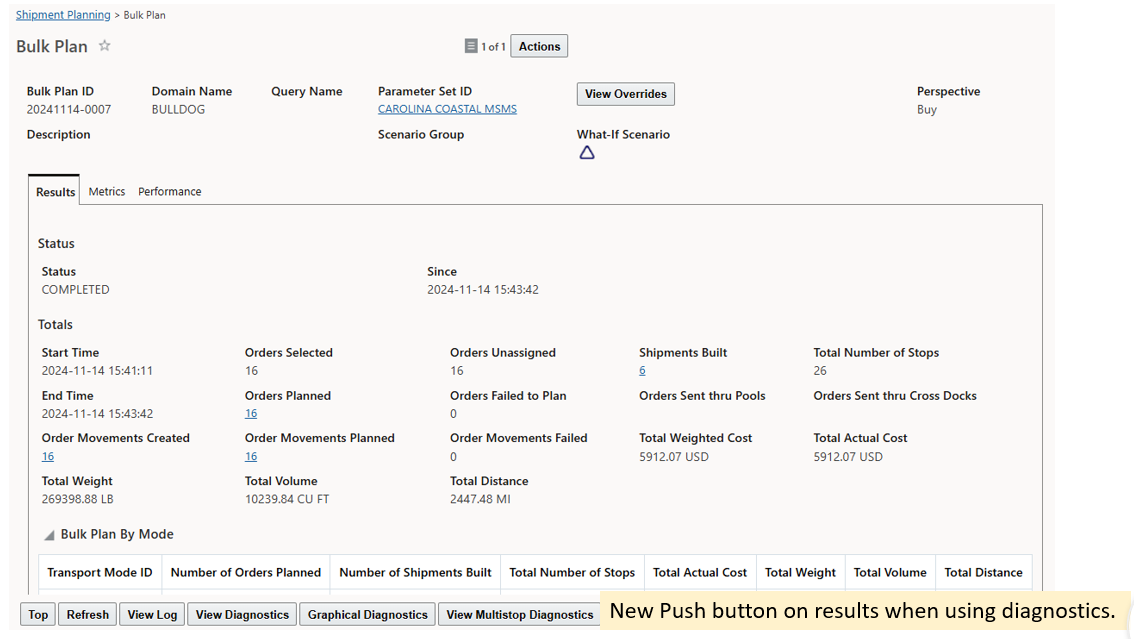
Bulk Plan Results with new Multi-Stop Diagnostics Button
The Push Button will bring up a screen that will have a display of the results of the pair-wise savings calculations. In addition, the highlighted savings will bring up a display below that explains the details of the direct shipments that were combined. The cost savings are influenced by the configuration of the MULTISTOP COST SAVINGS CHECK TYPE. For options 1, 2 and 3, the results will only include distance savings. For option 4, the cost savings will be shown.
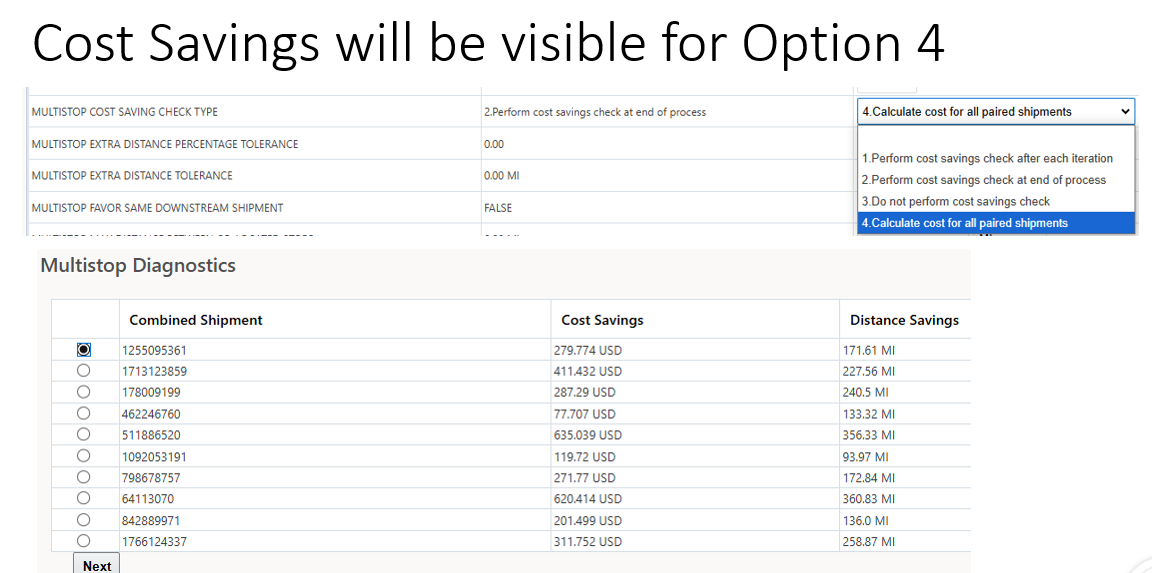
Multi-Stop Savings are influenced by the Multi-Stop Configuration
The next screen shot is the results that are seen with options 1, 2 and 3 and it also includes the details. At the bottom of the page is a button to download the Savings Matrix which will be available to view in a spreadsheet format. This will provide significantly more information.
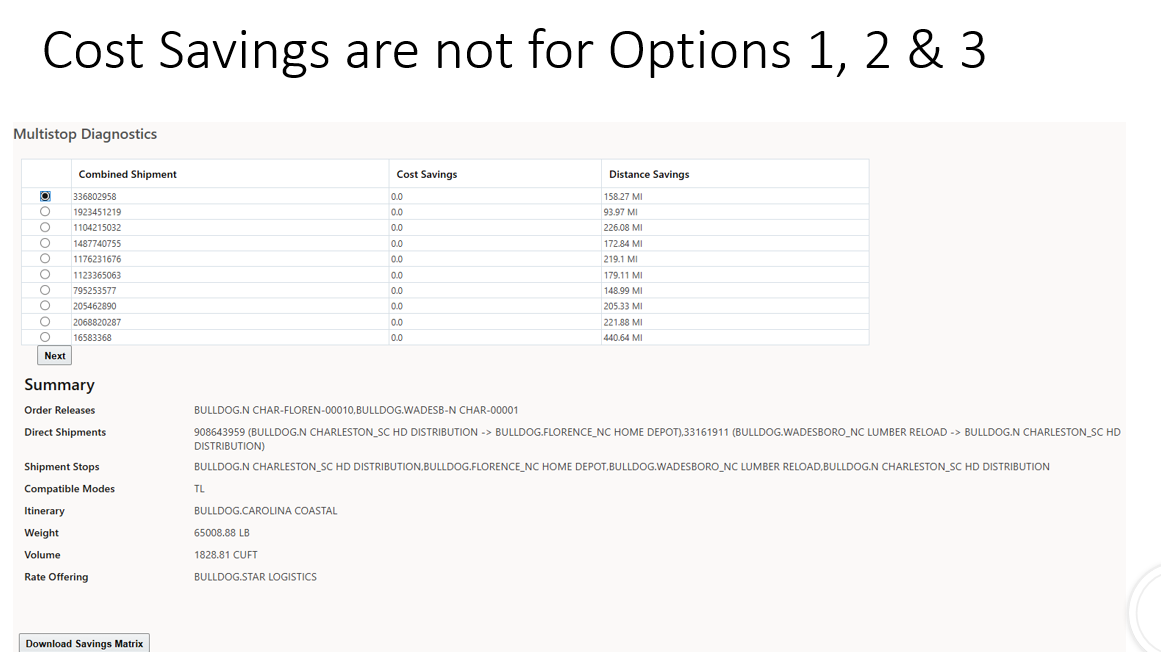
MS Diagnostics for Options 1, 2, and 3
The screen is limited to 50 rows of information. The downloaded savings matrix should be used to provide the additional information.
Currently, there is no indication of the greatest savings and that is likely to be improved in a future release.
The savings matrix spreadsheet is designed to provide the details of each iteration until the final iteration. The rows and columns have unique indicators that correspond to the detailed rows beneath the matrix. As most OTM users know, the matrix gets smaller with each iteration as rows and columns are removed by the pairing process that identifies the greatest savings. This spreadsheet supports both Sequential Savings and Concurrent Savings.
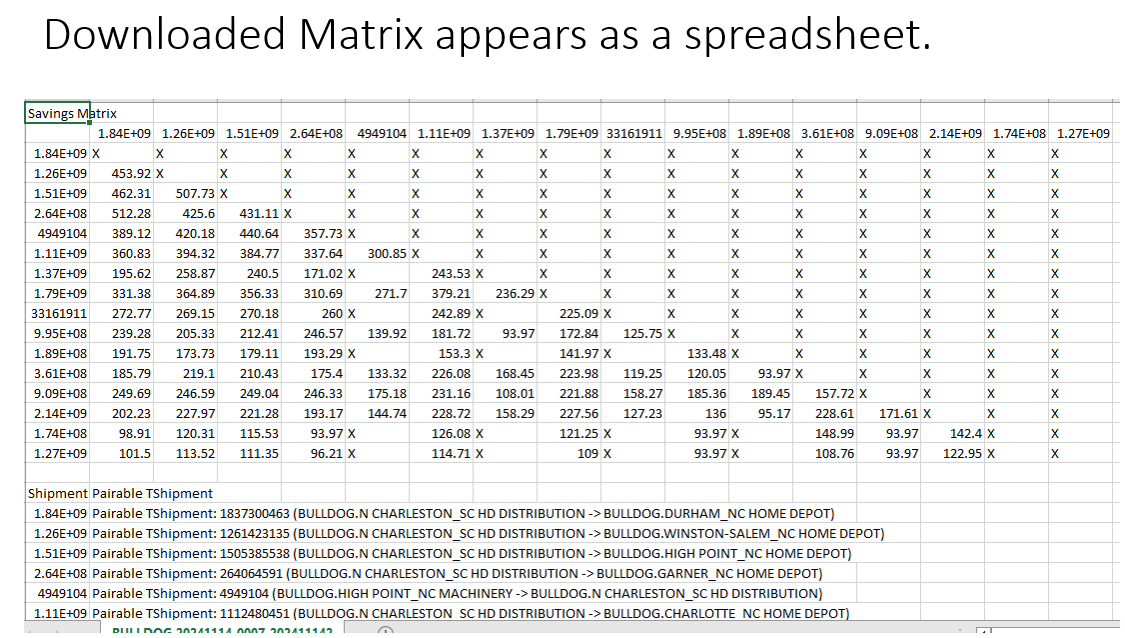
Multi-Stop Savings Matrix - First iteration
The final iteration will show the resulting shipments.
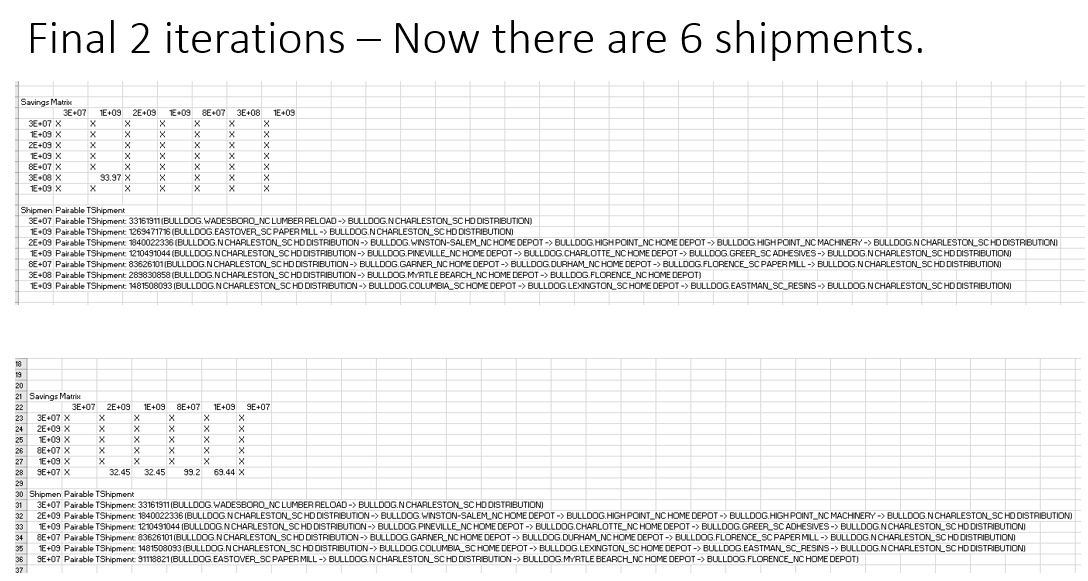
Multi-stop Savings Matrix - Final Iteration
The business benefit is that this is a new tool that can be used by Clients, Implementers, Support, and Development to understand the multi-stop process. Information like this has never been available before except to developers with home-grown tools. Now everyone will be able to see the impact of rates on the savings. Clients who use obsolete EDE (External Distance Engine) configuration like CITY will see ambiguous distance savings with multiple cells showing the same savings since distance savings in multiple cells will be the same. All of this knowledge will provide highly useful feedback to revise configuration to improve quality. This tool is the best way to be able to visualize the decision making logic and how it interacts with user supplied data.
Steps to Enable
Diagnostics Must be Invoked and a new parameter set to true.
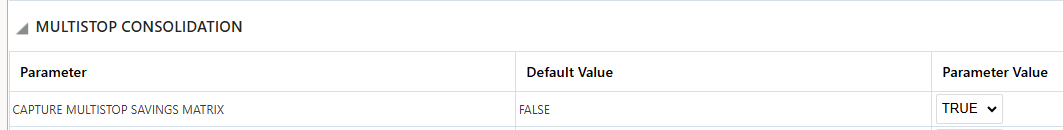
New Logic Configuration
Tips And Considerations
The new tool will open up a new world of information that has never been seen before. It will provide much needed feedback. Clients will be able to have a great introspective into their modeling because of this tool. What was guessed at before is now present will real data.