Redwood: Use a Default Page Layout to Review Sales and Operations Planning Plans
You can now view sales and operations plans by using a page layout with default set of tables and graphs relevant to the plans. This enhances plan data search and filtering, expands page layout options, and enables better personalization of data visualization. The default layout includes executive review plan summary level graphs and tables such as on financial forecasts, sales and consensus forecasts, operating plan values, new product revenue, and profit and loss. The default page can be easily customized to fit your own needs.
The Executive Review Plan Summary page is displayed by default when you open a sales and operations plan in the Redwood Supply Chain Planning work area.
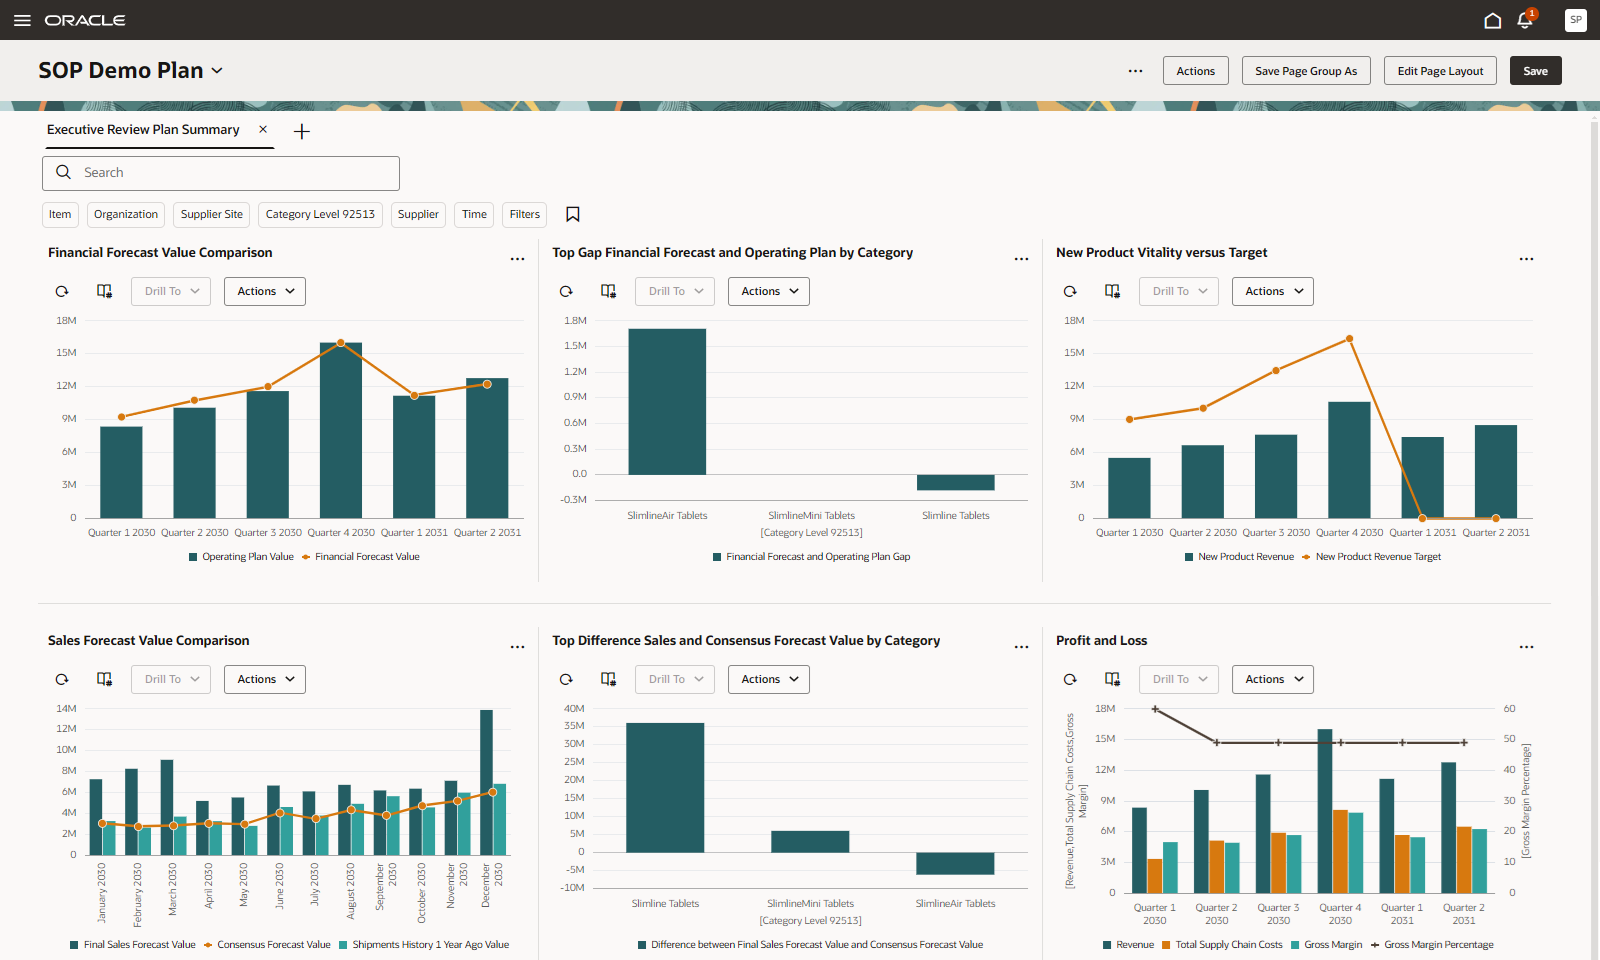
Executive Review Plan Summary Page
The Executive Review Plan Summary page includes six visualizations:
- Financial Forecast Value Comparison – A combination graph comparing the Operating Plan Value and Financial Forecast Value by quarter. The Operating Plan Value is the sum of the values of Shipment History Value and Constrained Forecast Value.
- Bars represent the Operating Plan Value.
- Line represents the Financial Forecast Value.
- Use the page-level filters to view by category.
- Top Gap Financial Forecast and Operating Plan by Category – A vertical bar graph displaying the gap between the Financial Forecast Value and the Operating Plan Value by category.
- The Financial Forecast and Operating Plan Gap measure calculates the difference between Financial Forecast Value and Operating Plan Value. A gap greater than 0 indicates a discrepancy that requires review.
- Drill to the Financial Forecast Value Comparison graph by category.
- New Product Vitality versus Target – A combination graph comparing the New Product Revenue and New Product Revenue Target by quarter.
- Bars represent the New Product Revenue, which is the revenue for products that have their Lifecycle Phase item attribute set to Prelaunch, Postlaunch, or Growth.
- Line represents the loaded New Product Revenue Target. Review New Product Revenue values that fall below target.
- Use the page-level filters to view by category.
- Sales Forecast Value Comparison – A combination graph comparing the Consensus Forecast Value, Final Sales Forecast Value, and Shipments History 1 Year Ago Value by month.
- Bars represent the Final Sales Forecast Value and Shipments History 1 Year Ago Value.
- Line represents the Consensus Forecast Value.
- Compares the sales and prior year’s forecast with the consensus forecast to identify differences in value.
- Use the page-level filters to view by category.
- Top Difference Sales and Consensus Forecast Value by Category – A vertical bar graph displaying the differences between the Final Sales Forecast Value and the Consensus Forecast Value by category.
- The difference between Final Sales Forecast Value and Consensus Forecast Value measure displays positive values where the Final Sales Forecast Value is higher than Consensus Forecast Value.
- Drill to the Sales Forecast Value Comparison graph by category.
- Profit and Loss – A combination dual Y-Axis graph comparing the Revenue, Total Supply Chain Costs, Gross Margin, and Gross Margin Percentage by quarter.
- Bars represent the Revenue, Total Supply Chain Costs, and Gross Margin on the Y-axis.
- Line represents the Gross Margin Percentage on the Y2-axis.
- Use the page-level filters to view profitability by category.
Steps to Enable
You don't need to do anything to enable this feature.
Tips And Considerations
The Executive Review Plan Summary page displays plan data in Gregorian months. For sales and operations plans that utilize different time levels, such as a manufacturing week or fiscal period, you can replicate the existing visualizations and adjust them to suit your specific needs.
- Use the Planning Visualizations page from the Actions menu to duplicate and reconfigure these visualizations.
- Use the Pages tab on the Planning Pages page from the Actions menu to create a new page containing these duplicated visualizations.
The Executive Review Plan Summary page is part of the Executive Review Plan Summary page group. It’s the only page in this page group.
- Use the Page Groups tab on the Planning Pages page from the Actions menu to create a new page group and set the default page group for sales and operations plans.
- The actions and menu layout in the page toolbar will be modified in coming updates.
Key Resources
- Refer to the Cloud Applications Readiness content for the following 25B Supply Chain Planning features for more information on the Supply Chain Planning work area as well as on the use of pivot tables and graphs:
- Analyze Sales and Operations Plans Using a Configurable Redwood Work Area
- Access Supply Chain Planning Work Area Using a New User Experience
- Use Pivot Tables to Analyze Plans Using a New User Experience
- Use Graphs to Analyze Plans Using a New User Experience
Access Requirements
Users who are assigned a configured job role that contains this privilege can access this feature:
- Monitor Sales and Operations Planning Work Area (MSC_MONITOR_SALES_AND_OPERATIONS_PLANNING_WORK_AREA_PRIV)
This privilege was available prior to this update.