Redwood: Search for Planning Data More Efficiently with a Streamlined Experience
Oracle Fusion Cloud Supply Chain Planning lets you control what data each planner can see. In the past, you might have seen items in search results that weren’t part of your scope, even though no actual data was available for them. With this update, global search is more focused. You’ll only see results you’re authorized to view, making searches cleaner and more relevant by filtering out unrelated options.
With the enhanced search filters, you can refine your planning and analysis by setting time range filters at the page level for visualizations in the existing page and for carry out any Drill To data action from a visualization, to another table, graph or page, using the time range context that’s defined as the time-range in the search.
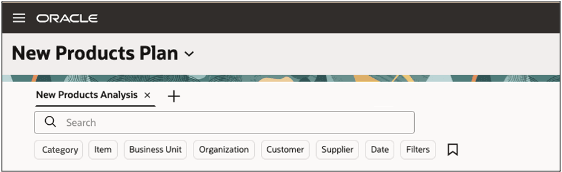
New Search Filters
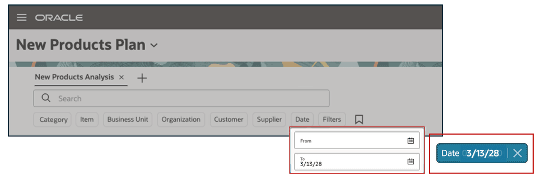
The search filters are categorized as:
- Product Dimension: By default, two filters are displayed. In the screenshot, the lowest level, Item and its immediate parent level Category are displayed. If there are multiple product hierarchies in a plan, then the immediate parent level is displayed for all the product hierarchies. You can see all the other levels by clicking the Filters search option.
- Organization Dimension: By default, two filter are displayed. In this example, the lowest level, Organization and its immediate parent level, Business Unit in the Organization hierarchy is displayed. You can see all the other levels by clicking the Filters search option.
- Customer
- Supplier
- Date
The other filter options appear in the side panel drawer.
The Date Filters
The date filters affect all time range aspects of a graph visualization. For example, Suggested Due Dates in a supplies and demand, exceptions dates From and To date ranges and End Demand date in a late demand analysis.
In the given visualization, the plan start date is 01/07/30 and the plan end date is 04/08/30. The time bucket defined for this plan is Week.
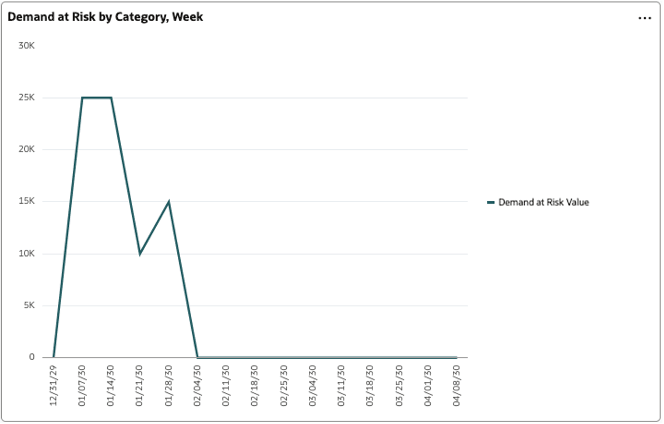
Visualization Filtered by Plan Start Date and Plan End Date
Filter by Date range – From and To date
When you are searching for a visualization by selecting either one of the From or To range criteria, the plan’s start and end dates are considered for the criteria left undefined.
Consider a scenario when the From field is undefined and the To field is defined with a date. In this case, the visualization considers the plan’s start date.
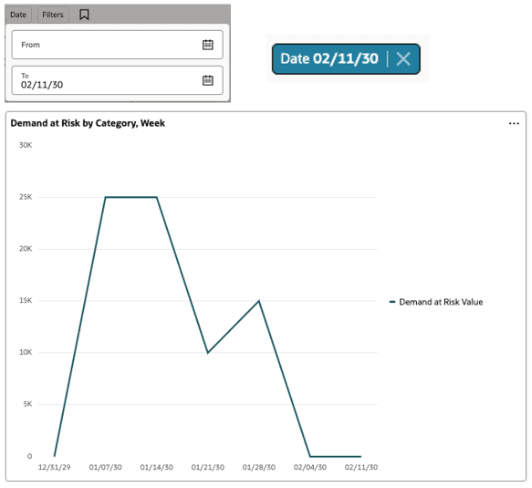
Graph Filtered Using Only The To field
Now consider a scenario when the From field is defined and the To field is undefined. In this scenario, the graph considers the plan’s end date.
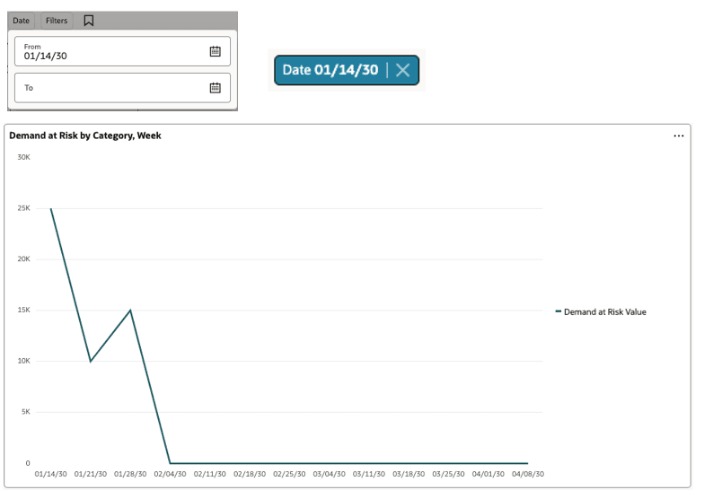
Graph Filtered Using Only the From field
Filter by Date range and Time – From and To date
The data properties of a graph with respect to the time filters are adjusted to honor the date range defined in the graph.
Filter with Only To Date in Range
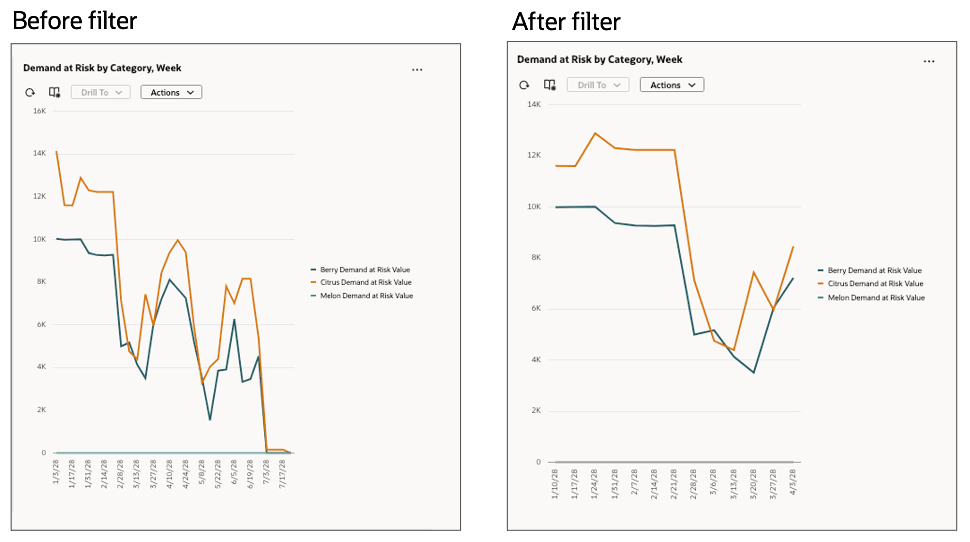
Before and After Filters Applied
When a date range is included in a graph, applying a date filter changes the graph's time frame range to show the data in line to the date filter applied.
Visualizing a Graph with Time-based Filters
Data relevant to the date range chosen as the date filter is displayed in graphs that don't explicitly display a date range but have time range criteria. The following graph, Most Overloaded Resources doesn’t display any dates on the graph.
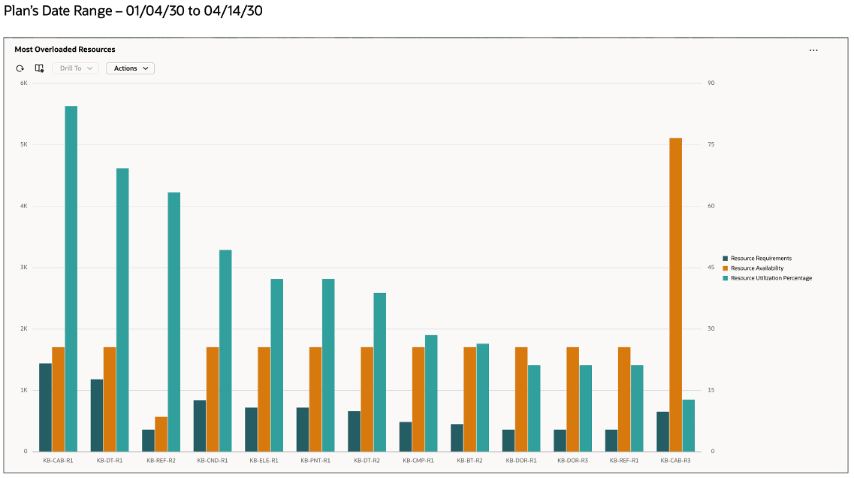
Graph filtered Without the Date Range
However, if you apply the date range filter criteria, the resource requirements for the date range are considered as the effective start and end dates. The following graph displays the associated resources data within the specifies date range.
Visualizing a Pivot Table with Time-based Filters
- Pivot Tables with time dimension: In Pivot tables, applying time range filters to the table shows or hides the data based on the specified time range. This also applies to the time range time buckets in the pivot table grid. Consider a scenario where the date range is specified in the To field as 3/13/28 for a pivot table.
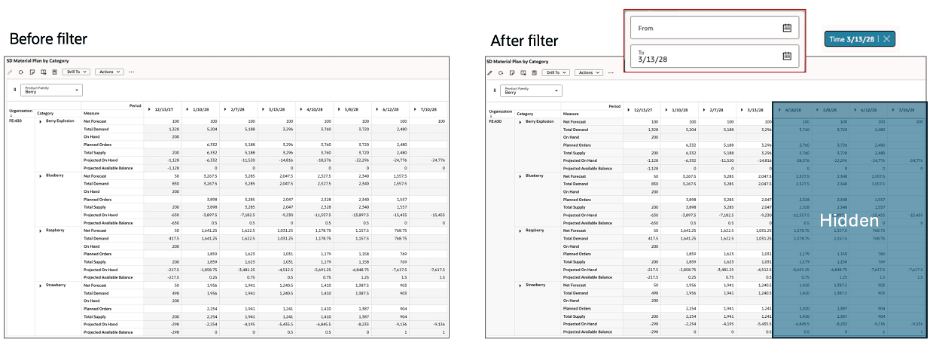
Data is Displayed or Hidden Based on the Time Range Specified
In the given pivot table, the data for the dates after the To date, 03/13/28 aren’t displayed.
- Pivot Tables without time dimension: Pivot tables that don’t explicitly display a time dimension as rows or columns, the date range filter display the data as associated with the entity data for the respective time period. In the following example, the Material plan is filtered by a date range. The pivot table data shows the measure data related to the filtered date range only.
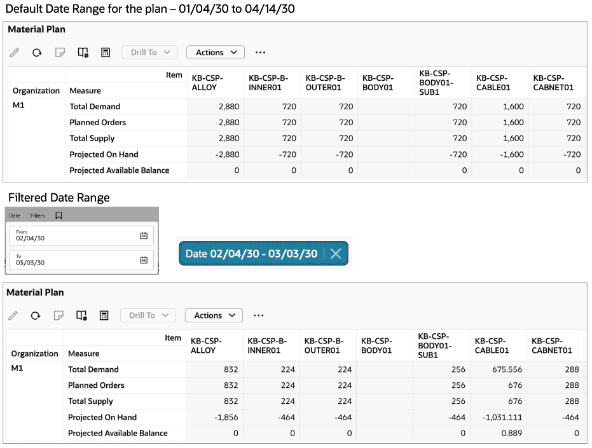
Pivot Table Using Date Range Filter
Visualizing Standard Tables
In case of standard tables, the data is filtered based on their corresponding time members. For example, Supplies and Demands use the time range Suggested Due Dates for orders.
Here’s a list of search filters based on the date columns and date range:
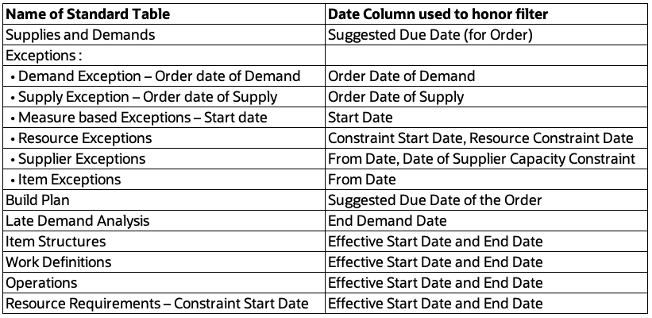
Date Columns for Standard Tables
Steps to Enable
You don't need to do anything to enable this feature.
Tips And Considerations
When the plan data changes, for example, when new plan members and levels are added to the plan's dimensions and hierarchies, run the plan. By doing this, the elastic search index is refreshed, so that you can conduct searches using the most recent data. If you don’t run the plan, the search filters might not reflect the most current data updates.
Access Requirements
Users who are assigned a configured job role that contains these privileges can access this feature:
- MSC_MONITOR_PLAN_INPUTS_WORK_AREA (enables access to work area and enables 'Plan Inputs' and 'Simulation Sets' in the plan switcher)
- MSC_MONITOR_DEMAND_AND_SUPPLY_PLANNING_WORK_AREA (enables access to work area and enables all Supply Plans, Demand Plans and Demand and Supply Plans in the plan switcher)
- MSC_MONITOR_SUPPLY_PLANNING_WORK_AREA (enables access to work area and enables all Supply Plans in the plan switcher)
- MSC_VIEW_PLANNING_OBJECTS_REST_SERVICE_PRIV (View Planning Objects Using REST Service)
View Planning Objects Using REST Service is a new privilege. - FND_SEARCH_FWK_MGR_PRIV (Grant Search Framework Manager Permissions)
- FUN_FSCM_REST_SERVICE_ACCESS_INTEGRATION_PRIV (Access FSCM Integration Rest Service)