Redwood: Set Up Waterfall and Trend Analyses and Plan Comparisons Using a New User Experience
In previous updates, using the classic interface, you could configure tables and graphs to easily visualize trends and comparisons across plans and plan versions. This update provides a similar user experience in the Redwood interface.
Using the Comparison tab for Redwood visualizations, you can configure waterfall analyses, trend analyses, and plan comparisons. Only one waterfall or trend analysis can be displayed at a time so that the visual presentation is clear. Waterfall and trend analyses each have a single checkbox that controls creation and automatic display. For plan comparisons, you can show the difference, percent difference, and absolute percent difference. Archives must be enabled for mean absolute percentage error (MAPE) calculations if the Use MAPE calculations checkbox is selected for waterfall or trend analyses; otherwise, the changes can’t be saved.
This capability improves Redwood visualizations by enabling waterfall and trend analyses that deliver clear insights and ensuring consistent behavior with the classic interface. The feature simplifies plan comparison and quickens decision making by automatically displaying selected difference types.
Working with Waterfall and Trend Analyses
To configure a visualization to display a waterfall analysis or trend analysis, open the visualization, and select Actions > Edit Properties.
The drawer for editing the visualization’s properties will open.
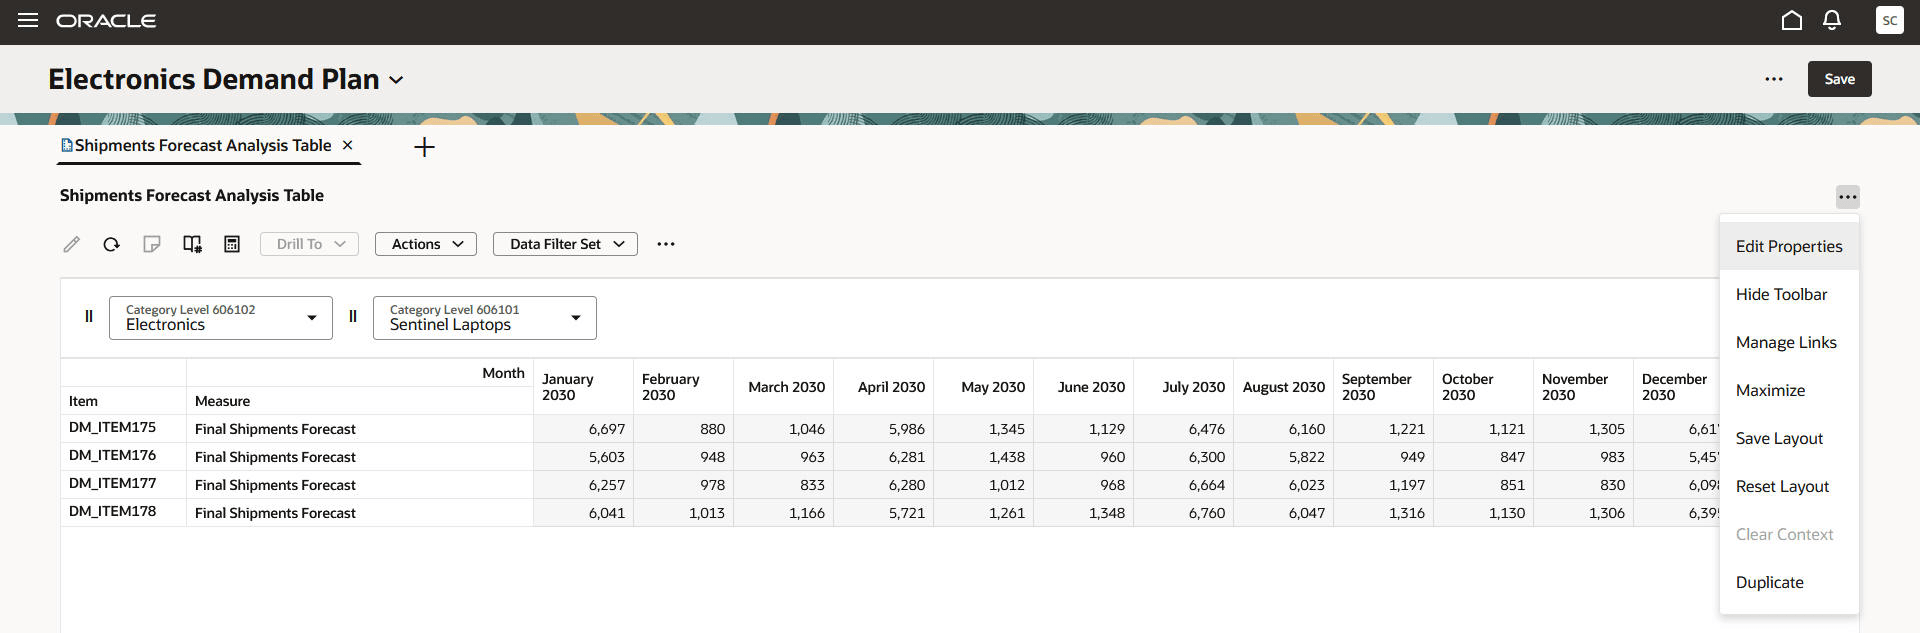
Edit Properties Menu Item
Navigate to the Comparison tab in the drawer.
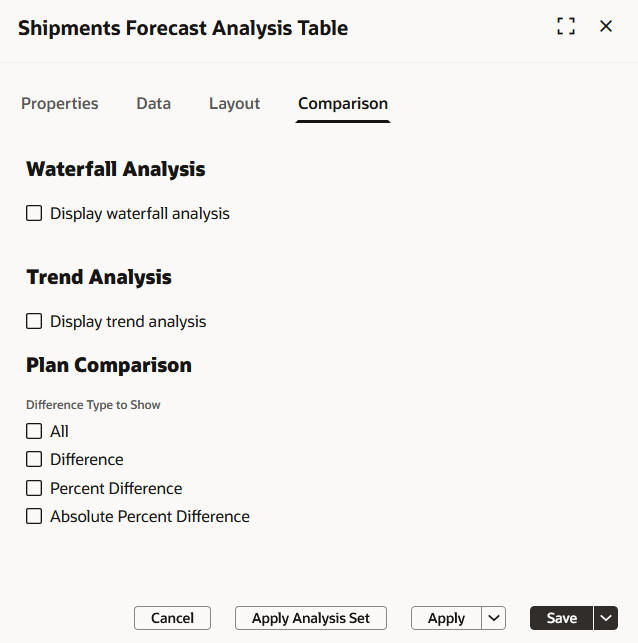
Comparison Tab
To display a waterfall analysis, in the Waterfall Analysis section, select Display waterfall analysis. Additional options will be displayed.
Select Use MAPE calculations only if the archives that you’re going to select were generated with the Build Plan Archive scheduled process, and the Enable for MAPE calculations checkbox was selected for the scheduled process.
Select the archives for the waterfall analysis. The available archives are those created 1 to 8, 13, 26, and 52 weeks ago.
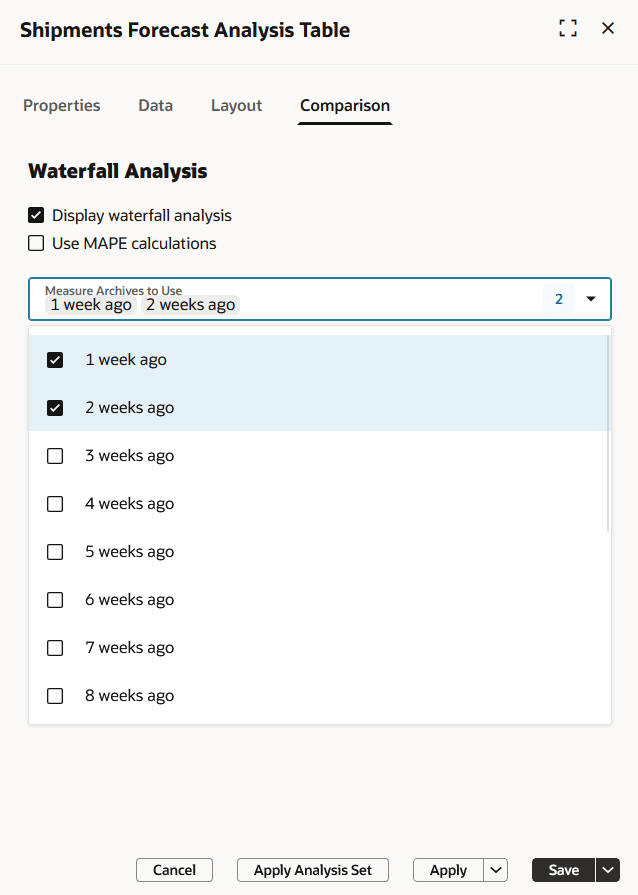
Options for Waterfall Analysis
To display a trend analysis, in the Trend Analysis section, select Display trend analysis. Additional options will be displayed.
Select Use MAPE calculations only if the archives that you’re going to select were generated with the Build Plan Archive scheduled process, and the Enable for MAPE calculations checkbox was selected for the scheduled process.
Specify the number of archives to use.
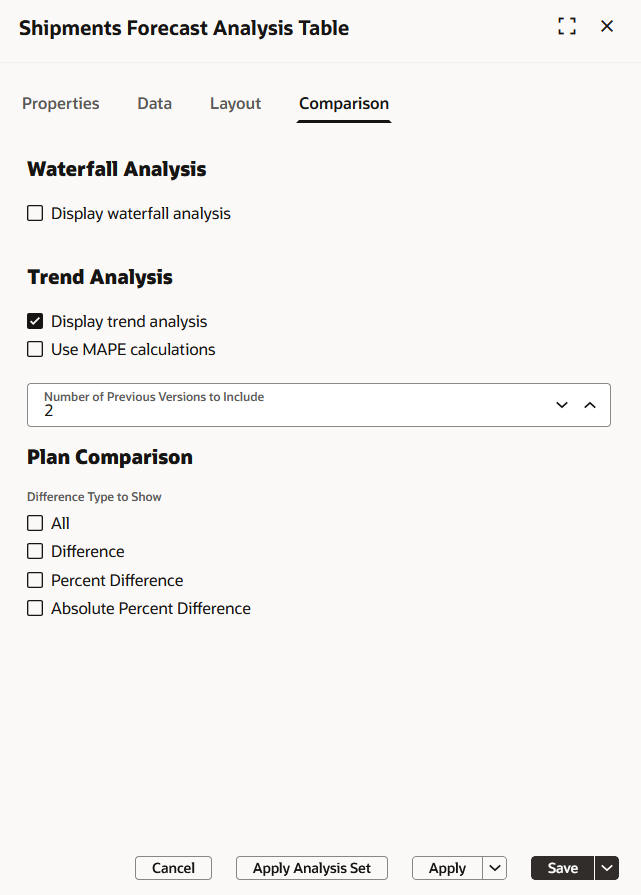
Options for Trend Analysis
You can’t display both a waterfall analysis and a trend analysis together.
Select Apply and Close to close the drawer, and display the waterfall or trend analysis without saving the settings. Select Save and Close to close the drawer, and display the waterfall or trend analysis after saving the settings.
For each measure, the visualization displays the current value of the measure and the value from each of the selected archives with the version of the archive appended to the measure name.
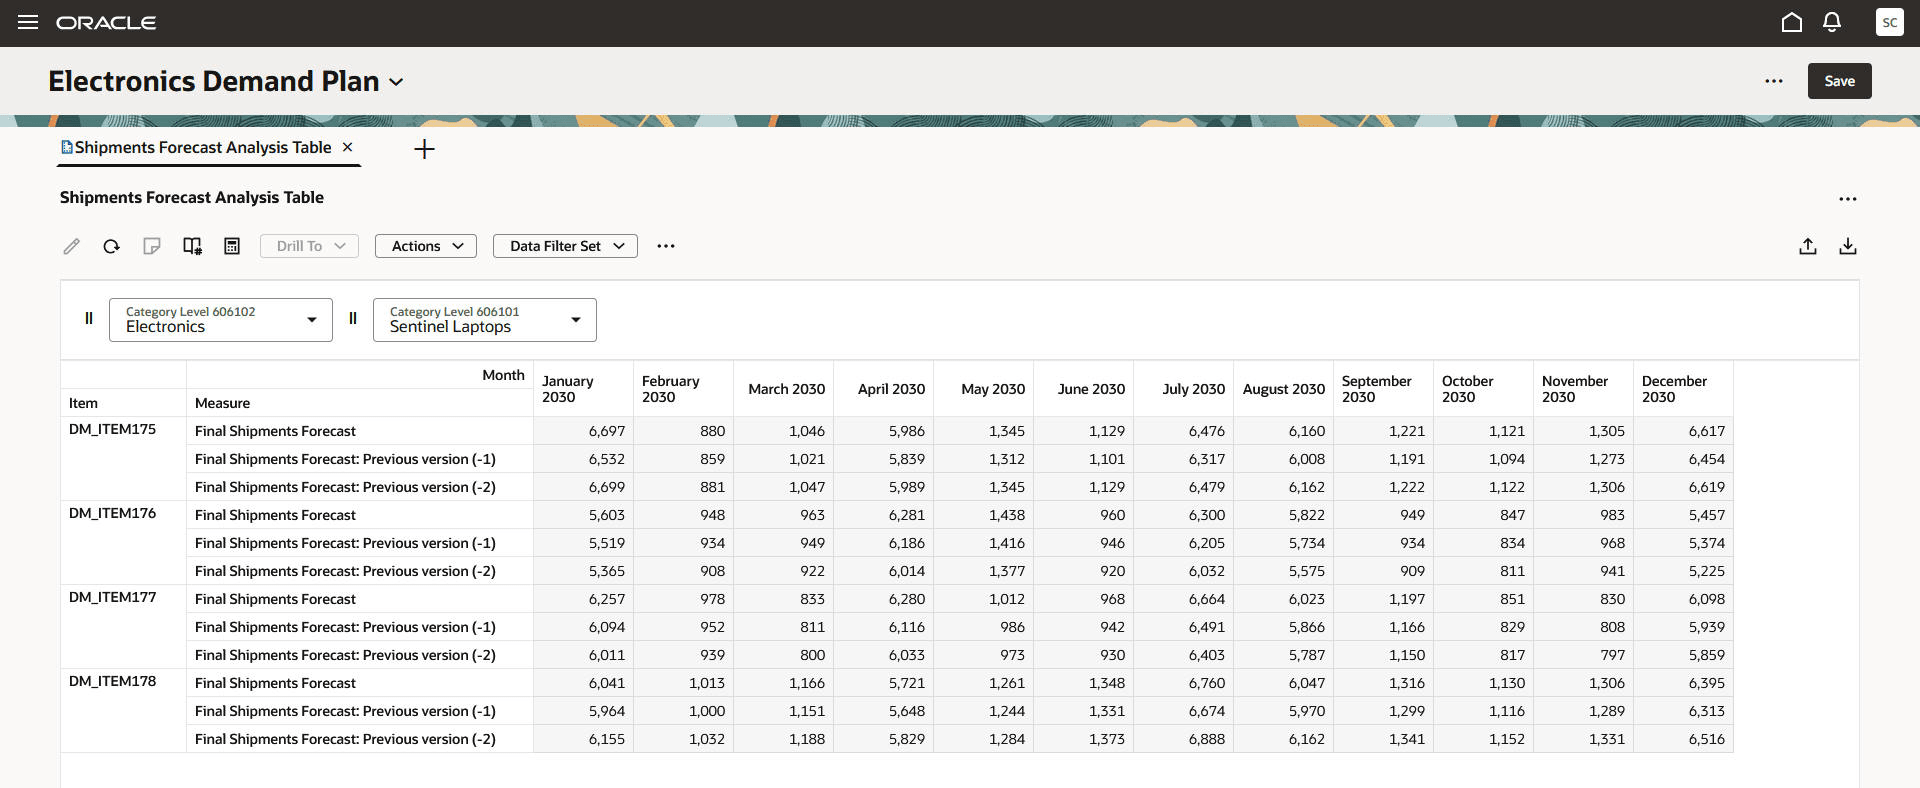
Table Displaying Trend Analysis
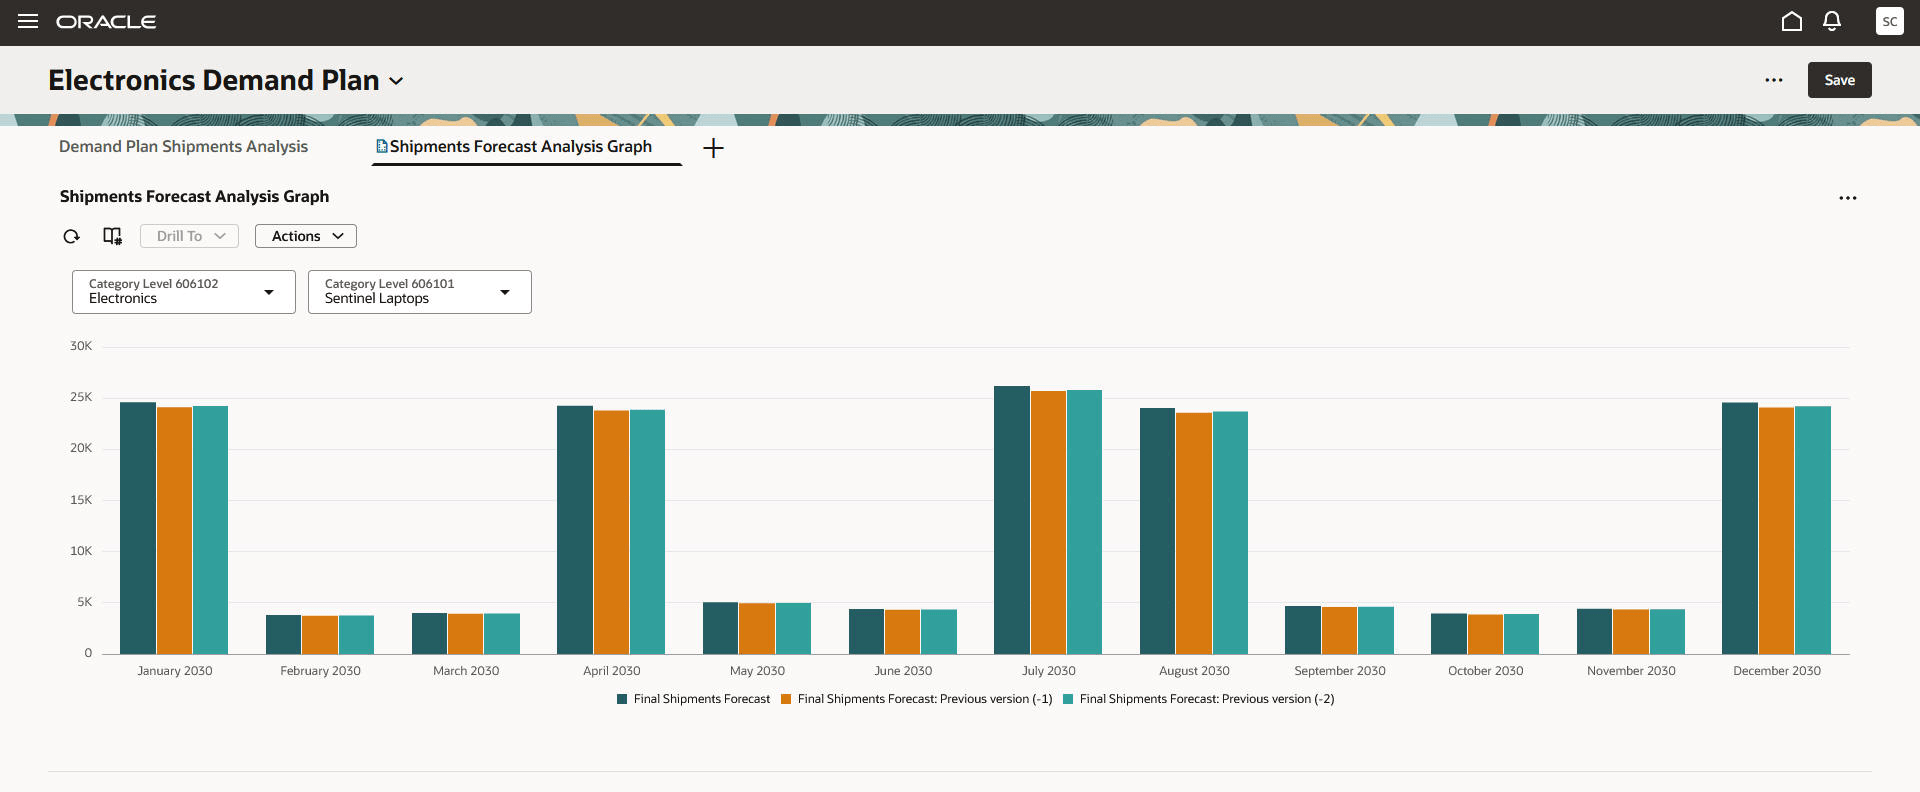
Graph Displaying Trend Analysis
Working with Plan Comparisons
To select the differences to show in a table when comparing plans, open the table in a plan, and select Actions > Edit Properties.
The drawer for editing the table’s properties will open.
Navigate to the Comparison tab in the drawer.
In the Plan Comparison section, select the checkboxes for showing the difference, percent difference, absolute percent difference, or all of the differences. You can select any combination of these checkboxes.
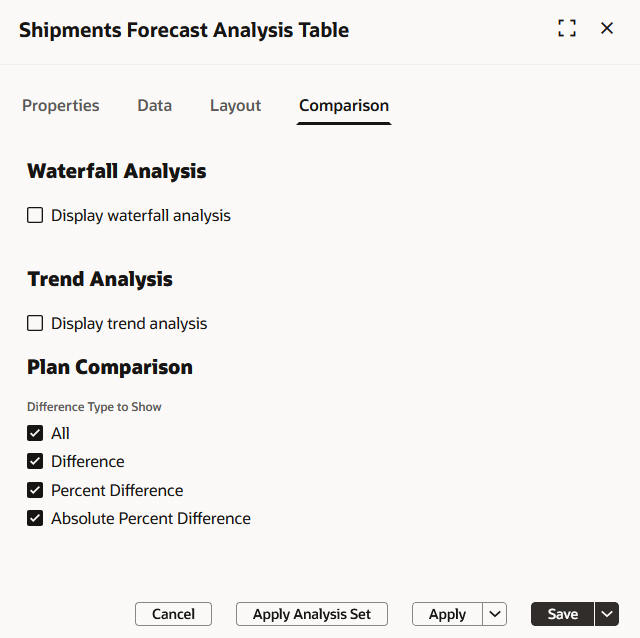
Checkboxes for Plan Comparison
Select Apply and Close to close the drawer, and apply the plan comparison settings without permanently saving them. Select Save and Close to close the drawer, and save the plan comparison settings.
These settings are used when you open the table through a plan and compare it with other plans or archives by selecting More Actions > Compare Plans and Archives.
For each measure, the table displays the values for the base plan and each plan and archive selected for comparison. Each difference type that you selected is also displayed for the measure with the values being the differences between the base plan and each plan and archive selected for comparison.
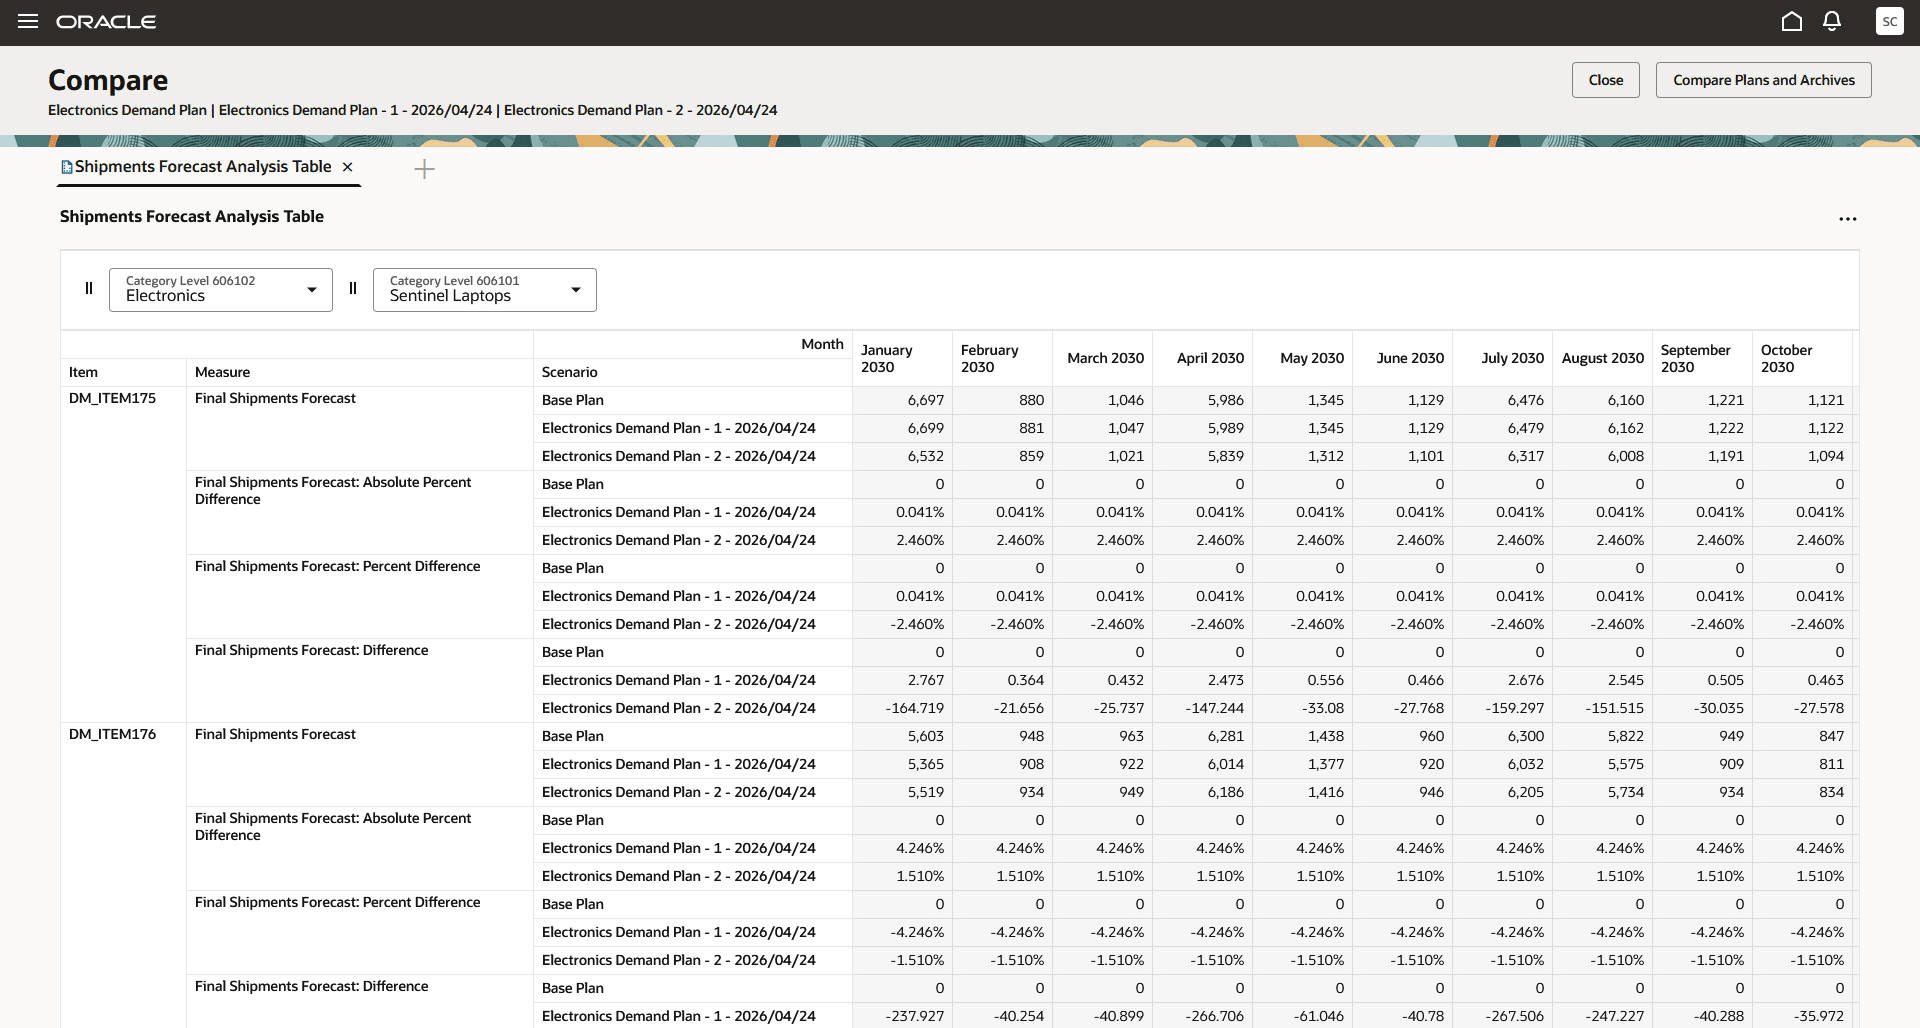
Table Displaying Differences
Plan comparison settings aren’t supported for graphs.
Steps to enable and configure
You don't need to do anything to enable this feature.
Key resources
Visit https://redwood.oracle.com/ for more information about the Redwood experience.
Access requirements
Users who are assigned a configured job role that contains these privileges can access this feature:
- Edit Planning Analytics Configuration (MSC_EDIT_PLANNING_ANALYTICS_CONFIGURATION_PRIV)
- Maintain Planning Tables (MSC_MAINTAIN_PLANNING_TABLES_PRIV)
- View Planning Analytics Configuration (MSC_VIEW_PLANNING_ANALYTICS_CONFIGURATION_PRIV)
- View Planning Objects Using REST Service (MSC_VIEW_PLANNING_OBJECTS_REST_SERVICE_PRIV)
These privileges were available prior to this update.