Sales Dashboard VB Studio Component Basics
Here's a quick overview of how the Sales Dashboard is represented in Oracle Visual Builder Studio components.
The Tabs on Your Sales Dashboard: Metric Cards and Contents Containers
Each tab in your dashboard is composed of two Oracle Visual Builder Studio fragments that hold the tab content:
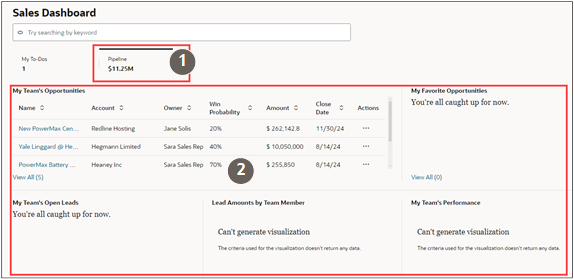
- Metric Card (identified by callout 1 in the following
screenshot)
A metric card holds the information at the top of the tab, which is always visible on the dashboard even when the tab isn't selected. It contains the tab title, and other optional information. The predefined Pipeline metric card for sales managers, for example, calculates and displays the sum of opportunity revenue.
All of the metric cards in a sales dashboard are listed in a Metrics Container. The metrics container, discussed in the next section, forms the shell of your sales dashboard. - Contents Container (callout 2)
The contents container holds the information in the tab. You can add up to 5 sections with tables, visualizations, and lists to each contents container.
The predefined pipeline contents container in the sales manager dashboard provide by Oracle, for example, displays a table of opportunities in the first section. Other sections display My Appointments, My Team's Open Tasks, My Open Tasks, and My Team's Overdue Tasks. All present information from different saved searches.
To the user, the metric card and the contents container form a single unit. However, the metric card and the contents container are separate entities in VB Studio. You must link them together in VB Studio to make them appear as a single tab.
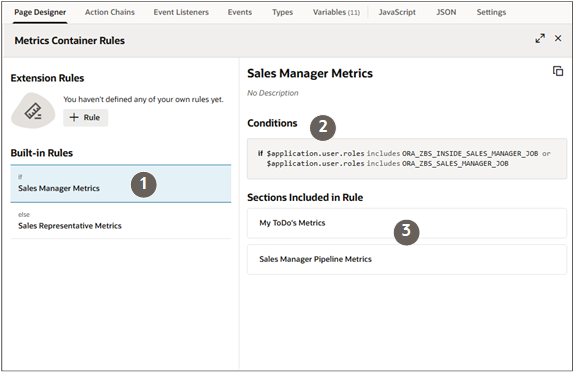
Metrics Container Instance: The Shell of Your Dashboard
In VB Studio, the contents of your sales dashboard is represented by a metrics container instance. Each metric container instance contains a list of the metric cards ( the tabs that users see).
This screenshot of a sales dashboard includes 2 tabs. The metric container instance includes 2 metric cards, one for each tab.

You create a rule for each metric container instance that determines who gets to see the sales dashboard it represents.
Here's a screenshot of how the metric containers are represented in Oracle Visual Builder Studio. The screenshot shows 2 metric containers for the 2 sales dashboards provided by Oracle.
| Callout Number | Description |
|---|---|
| 1 |
The metrics container for the predefined sales manager dashboard. The metrics containers Oracle provides are listed under the Built-in Rules heading. The metrics containers you create are listed under Extension Rules. |
| 2 |
Conditions specify who sees this dashboard. The predefined sales manager dashboard can be viewed only by the job roles listed. All other users see the sales representative dashboard because its condition is set to "Always Show". |
| 3 |
Metric cards (the tabs in the dashboard) are listed under the Sections Included in Rule heading. The order of the metric cards determines the order of the tabs. |
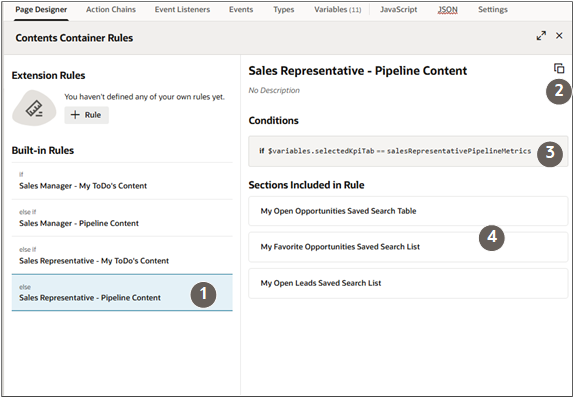
Contents Containers: Your Tab Content
The Contents Container specifies the contents of each tab in the sales dashboard. The contents container condition references the metric card in the metrics container.
| Callout | Description |
|---|---|
| 1 |
Each rule is a contents container instance. For example, the Sales Representative- Pipeline Content contents container provided by Oracle specifies which pipeline visualizations sales representatives see in the Pipeline tab. Because Oracle provides separate sales dashboards for sales representatives and sales managers, there's a separate pipeline contents container for sales managers listed under the Built-In Rules heading. |
| 2 | Click the Duplicate icon to duplicate the content provided by Oracle so you can edit it. |
| 3 | The conditions in each contents container reference the metric card which forms the top of the tab in the sales dashboard. |
| 4 | The items listed under the Sections Included in Rule heading specify what users see in the tab and in which order. |