Create an Express Report
You can create an express report either from scratch or by copying an existing report and editing the copy. If you're an administrator, you can share the reports you create with your organization. If you share reports, each individual sees only the information on the data they can access.
Here's how to create a report from scratch:
-
Open the Express Reports work area.
You can do so using a bookmarked URL, by clicking on the icon on the home page, or by making a selection in the Navigator.
- Click Create Report.
-
Enter a name and description.
-
Select the report type.
Click Create.
The application displays an initial report that includes the columns and filters present in the report type you selected. You can edit the report to your specifications.
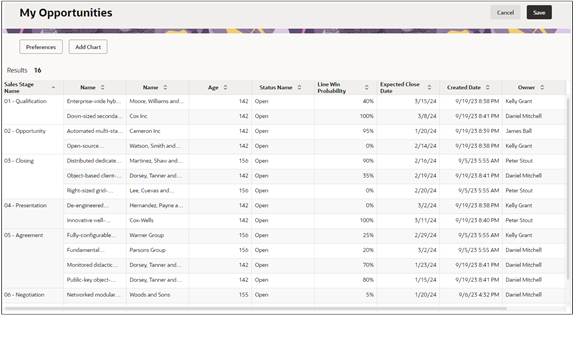
Here's a screenshot of a sample report.

Click the Preferences button to specify the columns, filters, and groups for your report.
For details, see the topics:
- Specify Which Columns Appear in Your Report
- Add Filters to Your Report
- Group Data in Your Report
- Rearrange Column Order in the Report
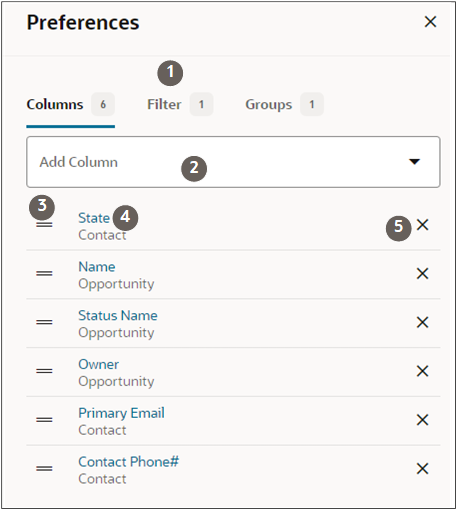
Here's a screenshot of the Preferences section with the Columns tab selected. The usage tips in the table apply to the other tabs as well.
Callout Number Description 1 Unlike Microsoft Excel where you edit in the columns themselves, in Express Reports you do all your work in the three tabs: Columns, Filters, and Groups. 2 Click Add Column (down arrow icon) to pick one of the most frequently used attributes or search for an attribute by keyword. 3 Drag by the lines icon to change order. 4 Drill down into an attribute to change its name. 5 Delete the item from the list. 
- Click Add Chart to add a chart to the report. You must have at least one group added to your report to build the chart. For details, see the topic Add a Chart to Your Report.